. 2002 Dec 15;22(24):10593-602.
doi: 10.1523/JNEUROSCI.22-24-10593.2002.

Timing and efficacy of Ca2+ channel activation in hippocampal mossy fiber boutons

Affiliations

Timing and efficacy of Ca2+ channel activation in hippocampal mossy fiber boutons

Josef Bischofberger et al. J Neurosci. .

Abstract

The presynaptic Ca2+ signal is a key determinant of transmitter release at chemical synapses. In cortical synaptic terminals, however, little is known about the kinetic properties of the presynaptic Ca2+ channels. To investigate the timing and magnitude of the presynaptic Ca2+ inflow, we performed whole-cell patch-clamp recordings from mossy fiber boutons (MFBs) in rat hippocampus. MFBs showed large high-voltage-activated Ca(2+) currents, with a maximal amplitude of approximately 100 pA at a membrane potential of 0 mV. Both activation and deactivation were fast, with time constants in the submillisecond range at a temperature of approximately 23 degrees C. An MFB action potential (AP) applied as a voltage-clamp command evoked a transient Ca2+ current with an average amplitude of approximately 170 pA and a half-duration of 580 microsec. A prepulse to +40 mV had only minimal effects on the AP-evoked Ca2+ current, indicating that presynaptic APs open the voltage-gated Ca2+ channels very effectively. On the basis of the experimental data, we developed a kinetic model with four closed states and one open state, linked by voltage-dependent rate constants. Simulations of the Ca2+ current could reproduce the experimental data, including the large amplitude and rapid time course of the current evoked by MFB APs. Furthermore, the simulations indicate that the shape of the presynaptic AP and the gating kinetics of the Ca2+ channels are tuned to produce a maximal Ca2+ influx during a minimal period of time. The precise timing and high efficacy of Ca2+ channel activation at this cortical glutamatergic synapse may be important for synchronous transmitter release and temporal information processing.


Figures
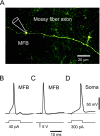
Fig. 1.
Fig. 1.
Rapid time course of locally evoked and orthodromically propagated APs in MFBs. A, Confocal image of an MFB filled with biocytin during the recording and stained with fluorescein avidin D after fixation. Note that the axon runs through the stratum lucidum parallel to the CA3 pyramidal cell layer.B, Current-clamp recording from an MFB in whole-cell recording configuration. A small current injection (40 pA, 10 msec) reliably evoked an AP with large amplitude and rapid time course.C, Current-clamp recording of an AP evoked by extracellular stimulation of the mossy fiber tract. D, AP recorded from a granule cell soma.
Fig. 2.
Fig. 2.
Presynaptic voltage-gated Ca2+currents in MFBs. A, Voltage-clamp recording of Ca2+ currents evoked by 20 msec voltage pulses from a holding potential of −80 mV to potentials of −70 to 60 mV in an MFB. B, The maximal current amplitude during the pulses is plotted against pulse potential (n = 16) and fitted with Equation 2 (continuous line; see Materials and Methods). C, To obtain the steady-state activation curve, tail current integrals were plotted against the amplitude of the preceding pulse (5 msec duration). Data were normalized to the maximal value in each experiment, averaged across experiments, and then normalized to the maximal average value (n = 6). The activation curve was fitted with a Boltzmann function (continuous line). norm., Normalized.
Fig. 3.
Fig. 3.
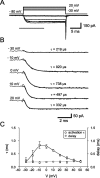
MFB Ca2+ currents show fast voltage-dependent activation kinetics. A, Ca2+ currents evoked by rectangular voltage pulses from −30 to 50 mV were analyzed. The part indicated by thehorizontal bar is shown in B at an expanded time scale. B, The activation of the Ca2+ currents could be well fitted by a monoexponential function with a short delay relative to the onset of the pulse (thick superimposed lines). C, The activation time constant τ (○) and the delay (■) are plotted against voltage (n = 6). The voltage dependence of the activation τ was fitted with Equation 3 (continuous line). The voltage dependence of the delay was fitted by linear regression (dashed line).
Fig. 4.
Fig. 4.
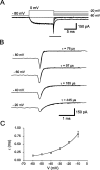
MFB Ca2+ currents show fast voltage-dependent deactivation kinetics. A, A voltage pulse to 0 mV was used to activate the Ca2+channels. The deactivation time course was analyzed after the membrane potential was stepped back to different potentials. The part indicated by the horizontal bar is shown in B at an expanded time scale. B, The deactivation time course could be well fitted with a monoexponential function (thick superimposed lines). C, The deactivation time constant τ is plotted against voltage (n = 6; same MFBs as in Fig. 3). The voltage dependence of the deactivation τ was fitted by a monoexponential function (continuous curve).
Fig. 5.
Fig. 5.
Rapid and effective activation of Ca2+ currents during AP waveforms. A, An AP waveform applied as a voltage-clamp command (top trace) instead of a rectangular voltage pulse evoked a transient Ca2+ inward current in an MFB (bottom trace). The orthodromically propagated AP was previously recorded from a different MFB. B, For a 5 msec prepulse period the command voltage was digitally set to +40 mV, which evoked a slightly larger Ca2+ peak current (continuous line) as compared with control (dashed line). C, An AP recorded from an MFB (dashed line) and a much slower somatic AP waveform (continuous line) evoked Ca2+currents with different amplitudes and time courses (bottom traces). Both somatic and MFB AP were evoked by direct current injection. D, The amplitude and half-duration of currents evoked by different AP waveforms are shown. The peak current was normalized to the maximal current amplitude of theIV relationship (at 0 mV) in the same boutons (corresponding to 100%). The bar graphsummarizes data from MFB AP experiments (n = 24), prepulse experiments (2–5 msec; n = 9), and soma AP experiments (n = 5); in all cases the waveforms were applied to MFBs.
Fig. 6.
Fig. 6.
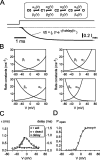
A kinetic model of Ca2+ channel gating in MFBs. A, A serial model with four closed states and one open state was developed (top panel). The occupancy of the open state was simulated (bottom panel), and the resulting traces were fitted with a monoexponential function with delayed onset, in the same way as the experimental data. Imax is the current corresponding to an open probability of 1. Pulse from −80 to 0 mV. B, The microscopic rate constants for the transitions αi(V) and βi(V) as calculated according to Equation 4, using the best-fit parameters given in Materials and Methods. Note the different steepness of the voltage dependence of the rates. C, Comparison of measured activation τ (filled circles), deactivation τ (open circles), and delay (squares) with the values predicted by the model (continuous lines).D, Comparison of the measured steady-state activation (filled circles) with the steady-state activation curve of the model (continuous line).
Fig. 7.
Fig. 7.
High open probability of the model Ca2+ channels during AP waveforms. A, A propagated MFB AP was used as a voltage command to simulate the activation of the model channels. The calculated open probability (gray line) was multiplied by the driving force for Ca2+ using Equation 2 to simulate the Ca2+ current. B, A 5 msec prepulse leads to a slight increase of the Ca2+ current (continuous line) as compared with control (dashed line). C, Comparison of the MFB AP (dashed line) with a slower somatic AP (continuous line). Note that the peak of the Ca2+ current occurs at different potentials, as indicated. D, Comparison of the relative peak current amplitude and the half-duration during an MFB AP, the prepulse simulation, and the soma AP application (filled bars). For the relative peak current, 100% corresponds to the simulated current amplitude during a rectangular voltage pulse to 0 mV.
Fig. 8.
Fig. 8.
Presynaptic Ca2+ inflow is highly sensitive to changes in AP amplitude and shape.A, The amplitude of the measured MFB AP was scaled from 10 to 120% in 10% steps and used to activate the Ca2+ channel model. B, The resulting peak amplitude and the total charge were plotted against the AP amplitude. The amplitude of the measured AP is indicated by thedashed vertical lines. C, The decay phase of the AP waveform was scaled by digitally shrinking or expanding the timescale of the trace after the peak from 50 to 500% in 50% steps.D, The resulting peak amplitude and the total charge were plotted against the AP half-duration. The half-duration of the measured AP is indicated by the dashed vertical lines. In B the data points were connected by straight lines, and the curves in D are fits with an exponential function plus a constant (top graph) or linear function (bottom graph).
Fig. 9.
Fig. 9.
Presynaptic Ca2+ inflow is highly sensitive to changes in gating kinetics. A, All rate constants in the kinetic model were multiplied by a constant factor (1–0.1 in steps of 0.1) to selectively slow channel gating without affecting steady-state activation. Simulated Ca2+ currents are shown superimposed.B, The gating was accelerated by multiplying rate constants with a constant factor (1–10 in steps of 1).C, D, Peak amplitude (C) and charge (D) of the simulated current, plotted against the scaling factor on a logarithmic scale. The properties of the original Ca2+ channel are indicated by the vertical dashed lines. Curves inC and D represent cubic spline interpolations.

References

    1. Acsády L, Kamondi A, Sík A, Freund T, Buzsáki G. GABAergic cells are the major postsynaptic targets of mossy fibers in the rat hippocampus. J Neurosci. 1998;18:3386–3403. - PMC - PubMed
    1. Augustine GJ. Regulation of transmitter release at the squid giant synapse by presynaptic delayed rectifier potassium current. J Physiol (Lond) 1990;431:343–364. - PMC - PubMed
    1. Augustine GJ. How does calcium trigger neurotransmitter release? Curr Opin Neurobiol. 2001;11:320–326. - PubMed
    1. Augustine GJ, Charlton MP, Smith SJ. Calcium entry into voltage-clamped presynaptic terminals of squid. J Physiol (Lond) 1985;367:143–162. - PMC - PubMed
    1. Bischofberger J, Jonas P. Action potential propagation into the presynaptic dendrites of rat mitral cells. J Physiol (Lond) 1997;504:359–365. - PMC - PubMed

LinkOut - more resources