Comparative Study
. 2002 Dec 15;22(24):10761-71.
doi: 10.1523/JNEUROSCI.22-24-10761.2002.

Changes in mitochondrial status associated with altered Ca2+ homeostasis in aged cerebellar granule neurons in brain slices

Affiliations
Comparative Study

Changes in mitochondrial status associated with altered Ca2+ homeostasis in aged cerebellar granule neurons in brain slices

Jie Xiong et al. J Neurosci. .

Abstract

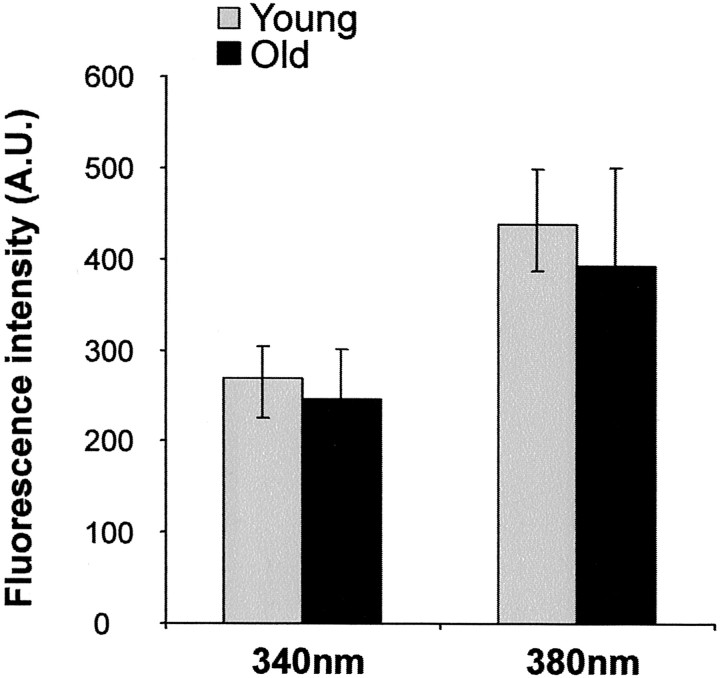
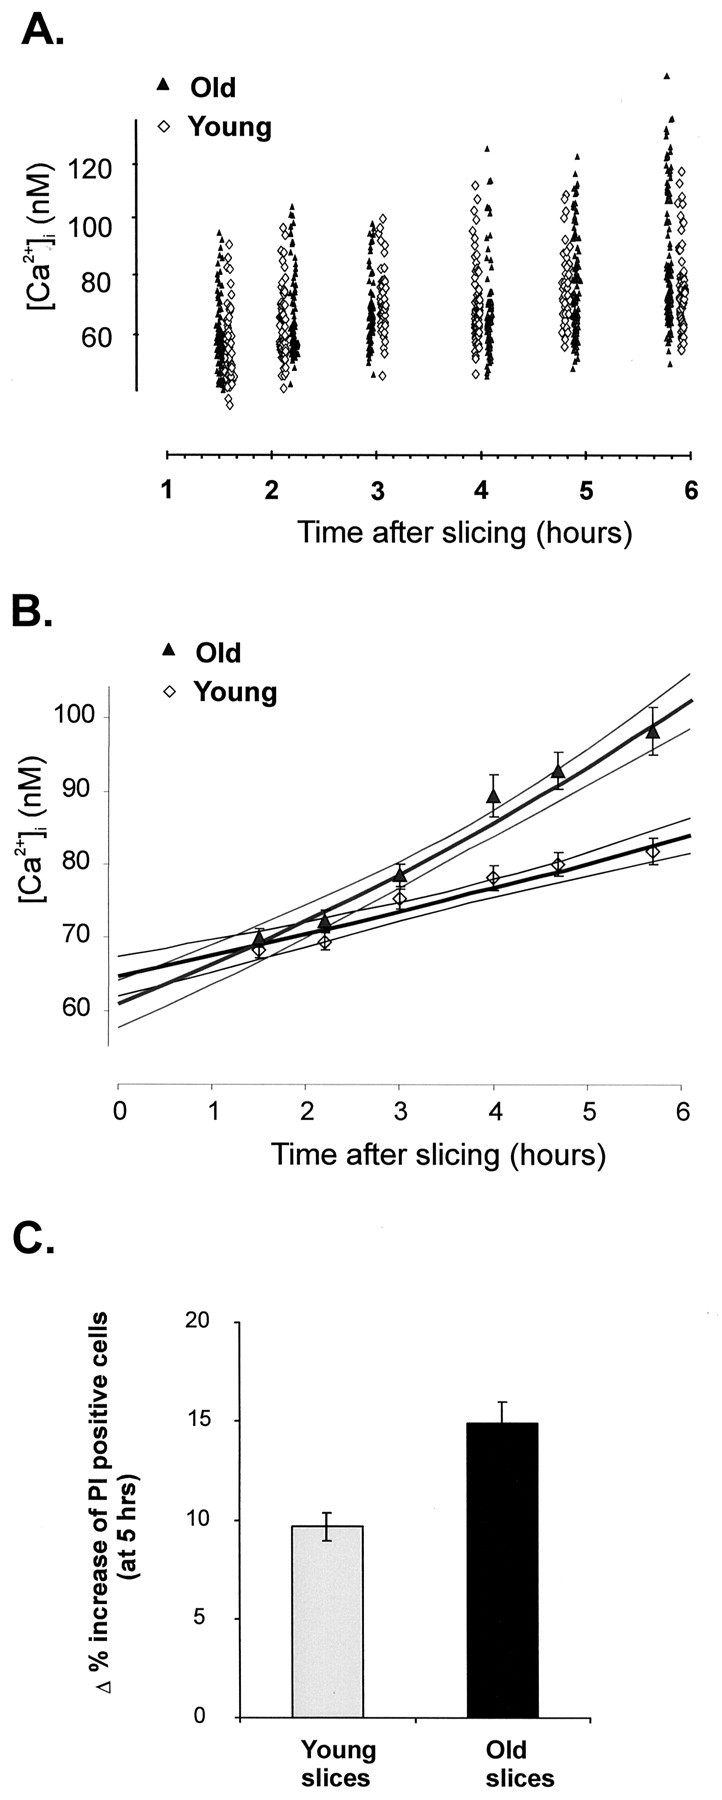
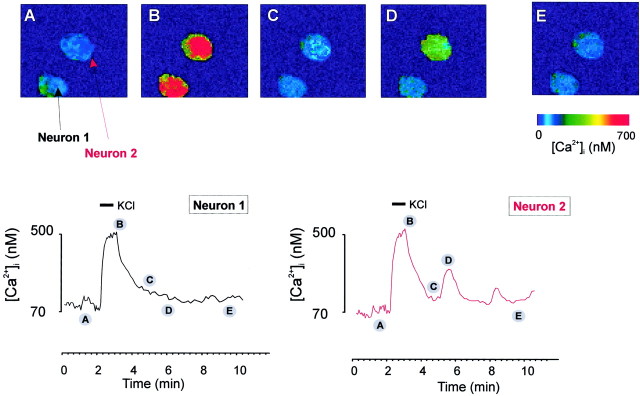
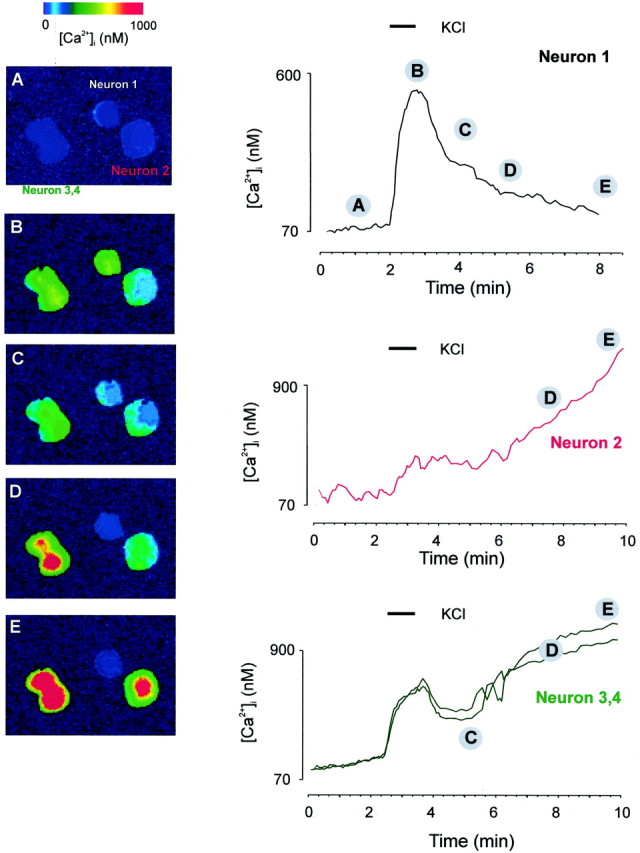
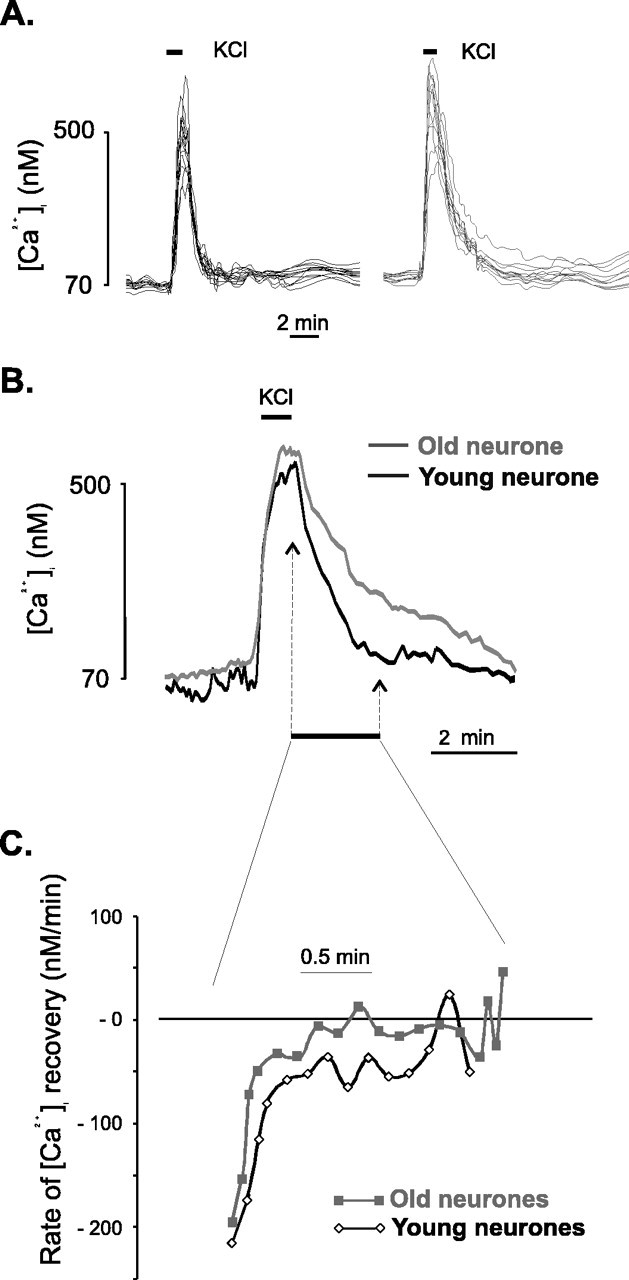
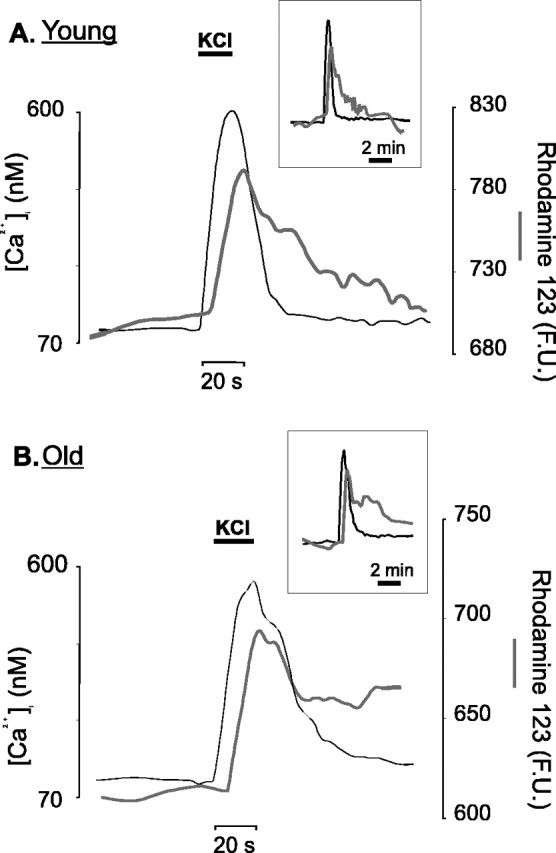
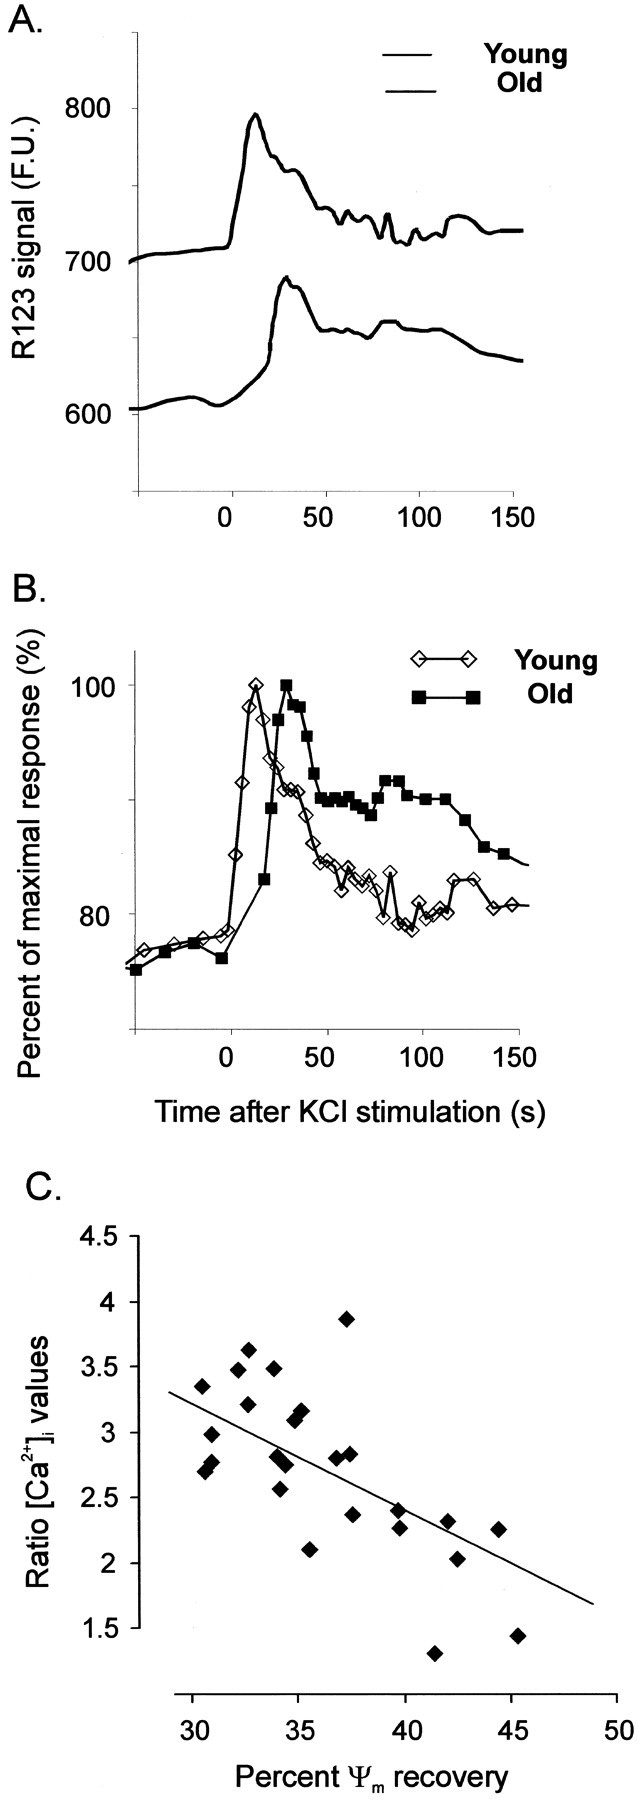
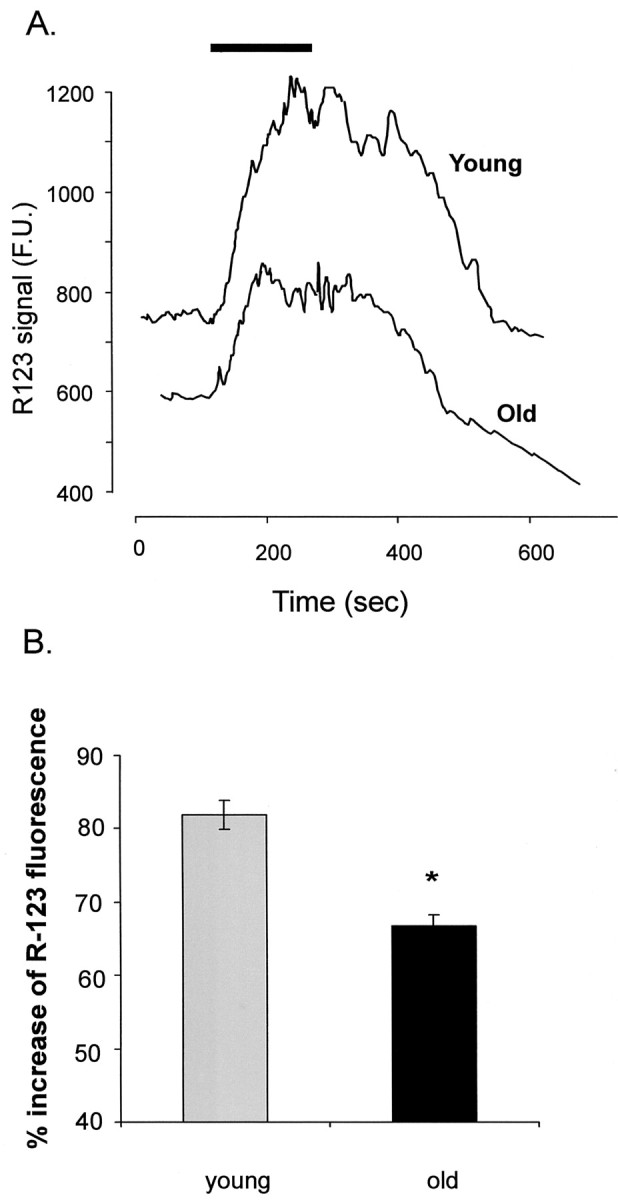
In the present work, we investigated the relationship between mitochondrial function and Ca2+ homeostasis in brain slices obtained from mice that aged normally. In acute preparations, the cerebellar neurons had similar values for intracellular free Ca2+ ([Ca2+]i) regardless of their age (range, 6 weeks to 24 months). However, compared with the young slices, the aged neurons (20-24 months) showed an enhanced rate of [Ca2+]i increases as a function of the time the slices were maintained in vitro. When slices were stimulated (KCl depolarization), there were significant differences in the patterns of [Ca2+]i signal displayed by the young and old cerebellar granule neurons. More importantly, the aged neurons showed a significant delay in their capacity to recover the resting [Ca2+]i. The relationship between [Ca2+]i and mitochondrial membrane potential was assessed by recording both parameters simultaneously, using fura-2 and rhodamine-123. In both young and aged neurons, the cytosolic [Ca2+]i signal was associated with a mitochondrial depolarization response. In the aged neurons, the mitochondria had a significantly longer repolarization response, and quantitative analysis showed a direct correlation between the delays in mitochondrial repolarization and [Ca2+]i recovery, indicating the causal relationship between the two parameters. Thus, the present results show that the reported changes in Ca2+ homeostasis associated with aging, which manifest principally in a decreased capacity of maintaining a stable resting [Ca2+]i or recovering the resting [Ca2+]i values after stimulation, are primarily attributable to a metabolic dysfunction in which the mitochondrial impairment plays an important role.


Figures

Fig. 1.
Fig. 1.
Efficiency of fura-2 loading in cerebellar slices obtained from young and aged animals. Images (separate for 340 and 380 nm excitation wavelengths) were obtained ∼40 μm below the slice surface. The graph compares the background-subtracted fluorescence levels for 340 and 380 nm images, comparing the young and old slices (mean ± SEM of 7 separate sets of images collected from 4 animals for the young group and 3 animals for the old group). No significant differences were found between the young and the old animals.A.U., Arbitrary units.
Fig. 2.
Fig. 2.
Measurement of resting [Ca2+]i at early time points after slice isolation. Brain slices were loaded with fura-2 AM after a minimal re-equilibration period, and all [Ca2+]i recordings were performed within 60–90 min after brain dissection. The numbers on the graph represent the numbers of neurons in each respective age group. There was no statistical significant difference between the mean resting [Ca2+]i value for any of the age groups (one-way ANOVA).
Fig. 3.
Fig. 3.
Analysis of resting [Ca2+]i values of cerebellar granule neurons from young (6 weeks) and aged (24 months) slices, maintainedin vitro for extended times. A, Scatterplot of resting [Ca2+]i values of cerebellar granule neurons from young (6 weeks) and aged (24 months) slices, maintained in vitro. After cutting, the slices were maintained in a brain slice holding chamber, in aCSF bubbled with O2 and CO2, for various periods of time. For each age, three separate animals were used; for each time point, a separate slice was loaded with fura-2 AM at the respective time point. The slices were imaged [340 and 380 nm images were taken of several fields (5–7 per slice)] and the resting [Ca2+]i values were calculated offline. B, Graph of the mean ± SEM [Ca2+]i value for each time point and for each experimental group presented in A. The data inA were curve-fitted with various linear and nonlinear models to find the best fit, as described in Results. The graph shows the exponential best fit for each of the data sets (Young and Old), together with the calculated 95% CL, to illustrate the fact that for the first 3 hr the curves are superimposable, after which time the curves become significantly different. C, Increase in neuronal death in slices maintained in vitro for 5 hr. Slices were loaded for 10 min with a PI/Hoe mixture at 1 hr after slice isolation and after 6 hr of in vitro maintenance in the slice-holding chamber (3 young animals, 7 slices at 1 hr and 6 slices at 6 hr; 3 old animals, 5 slices for both 1 and 6 hr). Images of two to three fields per slice were taken, and the number of PI-positive cells (normalized for the total number of cells as labeled by Hoe) was calculated. The graph shows the percentage increase in the number of PI-positive cells over the 5 hr interval of in vitro maintenance.
Fig. 4.
Fig. 4.
Depolarization-induced [Ca2+]i responses in cerebellar granule neurons in slices from young (6-week-old) animals. Slices (250 μm thickness) were loaded with 10 μm fura-2 AM, mounted in a perfusion chamber, and perfused through a plastic pipette brought with a micromanipulator to the vicinity of the area visualized through the microscope objective (perfusion rate, 1.5 ml/min). KCl (50 mm) was applied as indicated by the barabove the Ca2+ trace. The figure represents two individual Ca2+ traces obtained from the two neurons in the granular area of the cerebellar slice. For the set of images labeled A–E and corresponding to the regions labeled A–E on the Ca2+ traces, a mask obtained from the 380 nm images was applied to reduce the surrounding noise signal.
Fig. 5.
Fig. 5.
Depolarization-induced [Ca2+]i responses in cerebellar granule neurons in slices from old (22- to 24-month-old) animals. Slices (250 μm thickness) were treated and perfused as described in the legend to Figure 4. KCl (50 mm) was applied as indicated by the bar above the Ca2+trace. The figure represents four individual Ca2+traces obtained from four neurons in the granular area of the cerebellar slice (labeled 1–4). For the set of images labeled A–E and corresponding to theregions labeled A–E on the Ca2+traces, a mask obtained from the 380 nm images was applied to reduce the surrounding noise signal.
Fig. 6.
Fig. 6.
Comparison of [Ca2+]i response to neuronal depolarization in cerebellar granule neurons in slices from young and aged animals. A, Illustration of the range of [Ca2+]i responses to depolarization-evoked stimulation (indicated by the barabove the traces) in a young slice (left) and an old slice (right). For each panel, the traces show data from two separate experiments. B, Superimposition of mean [Ca2+]i traces obtained from cerebellar granule neurons in response to KCl-evoked depolarization in young (black line) and old (gray line) animals. For the aged group, only neurons that showed a monophasic response with full recovery of the resting [Ca2+]i were included for analysis. The traces are aligned for the initiation time point. The traces show the average trace obtained from a representative experiment (7 neurons for the young slices and 5 for the old slices).C, The rate of [Ca2+]irecovery was calculated from the [Ca2+]i values (for the period of time marked in A) as the first-order differential of the Ca2+ trace with respect to time, and is expressed in units of ratio per minute. The first data point displayed on the graph corresponds to the moment at which KCl perfusion was stopped, and the trace covers the period of time highlighted in B. The two-factor ANOVA on the two data sets (young and old) indicated a statistically significant difference between them (p = 0.015).
Fig. 7.
Fig. 7.
Simultaneous measurements of [Ca2+]i and mitochondrial membrane potential. The slices were loaded sequentially with 10 μmfura-2 AM and 10 μm rhodamine-123 and perfused with 50 mm KCl as indicated by the bars above the traces. A, A trace representative of an individual cerebellar granule neuron recorded in a brain slice from a young animal (6 weeks of age). [Ca2+]i values (left axis) are in nanomolar Ca2+, whereas the rhodamine-123 readings (right axis) are expressed as fluorescence units (F.U.), in effect, gray-level values. Each individual time point represents the average signal derived from an ROI that covered the whole of the neuronal soma.Inset, Combined traces for the length of the entire experiment. B, Same presentation, but the trace illustrates the response of a single cerebellar granule neuron from an aged (23-month-old) animal. Thin black lines, [Ca2+]i; gray lines, rhodamine-123 signals.
Fig. 8.
Fig. 8.
Comparison of the response of rhodamine-123 to neuronal depolarization in cerebellar granule neurons in slices from young and aged animals. A, The average rhodamine-123 (R123) fluorescence traces from one representative experiment (young slices, 7 neurons; old slices, 6 neurons) are plotted, in fluorescence units (F.U.) against time, for the first 150 sec after the initiation of KCl perfusion. B, The same set of data are replotted, normalizing for the maximal rhodamine signal for each group independently. Traces are carefully aligned so that time = 0 corresponds to the start of the KCl perfusion, which lasted 30 sec.C, Correlation between the mitochondrial Ψmito and [Ca2+]irecovery measured at 60 sec after the initiation of neuronal stimulation. For calculation of the Ψmito recovery, the amplitude of the depolarization-evoked mitochondrial response (in fluorescence units) was taken as 100%, and the amount of fluorescence decrease associated with mitochondrial repolarization was expressed as a percentage of this value. For calculation of the [Ca2+]i recovery, the ratio between the [Ca2+]i value at 60 sec and the resting [Ca2+]i was calculated and is expressed on the ordinate. The solid line shows the linear regression best fit for the experimental values.
Fig. 9.
Fig. 9.
Carbonylcyanidep-(trifluoromethoxy)phenylhydrazone (FCCP)-induced release of rhodamine-123 from loaded slices.A, Traces of FCCP (1 μm)-induced release of rhodamine-123 (R123) from slices obtained from young and old animals. Each trace represents the average of raw rhodamine fluorescence signals from one individual experiment (13 cells for the young and 11 cells for the old) evoked by FCCP during the exposure time indicated by the solid bar above the traces.B, Bar graph (mean ± SEM from 7 images from 3 separate animals for each age group) of the FCCP effect on the rhodamine-123 (R-123) signal. In the old slices, the protonophore induces a significantly (*p < 0.001) lower increase in the rhodamine-123 signal, indicating lower rhodamine-123 loading.

Similar articles

Cited by

References

    1. Ames BN, Shigenaga MK, Hagen TM. Mitochondrial decay in aging. Biochim Biophys Acta. 1995;1271:165–170. - PubMed
    1. Barnes CA. Normal aging: regionally specific changes in hippocampal synaptic transmission. Trends Neurosci. 1994;17:13–18. - PubMed
    1. Campbell VA, Segurado R, Lynch MA. Regulation of intracellular Ca2+ concentration by interleukin-1β in rat cortical synaptosomes: an age-related study. Neurobiol Aging. 1998;19:575–579. - PubMed
    1. Cortopasi G, Wong A. Mitochondria in organismal aging and degeneration. Biochim Biophys Acta. 1999;1410:183–193. - PubMed
    1. Duchen M. Contributions of mitochondria to animal physiology: from homeostatic sensor to calcium signalling and cell death. J Physiol (Lond) 1999;516:1–17. - PMC - PubMed

Publication types

MeSH terms