. 2002 Dec 15;22(24):11004-18.
doi: 10.1523/JNEUROSCI.22-24-11004.2002.

Interaction of excitation and inhibition in anteroventral cochlear nucleus neurons that receive large endbulb synaptic endings

Affiliations

Interaction of excitation and inhibition in anteroventral cochlear nucleus neurons that receive large endbulb synaptic endings

Cornelia Kopp-Scheinpflug et al. J Neurosci. .

Abstract

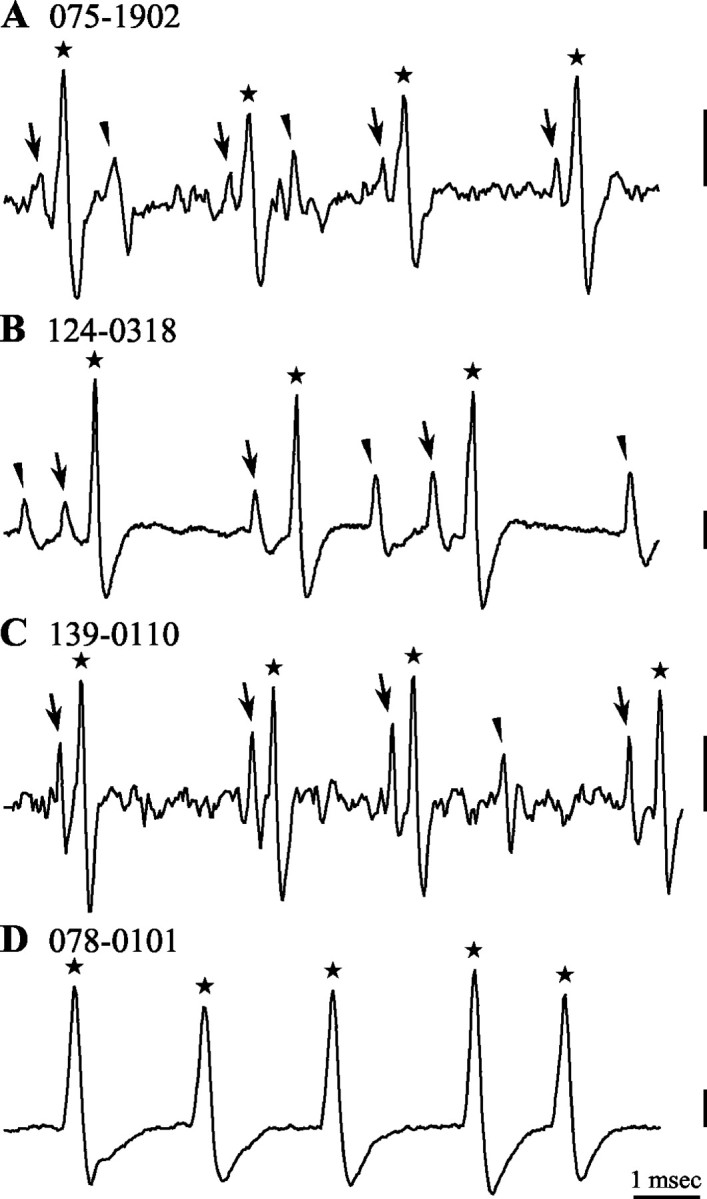
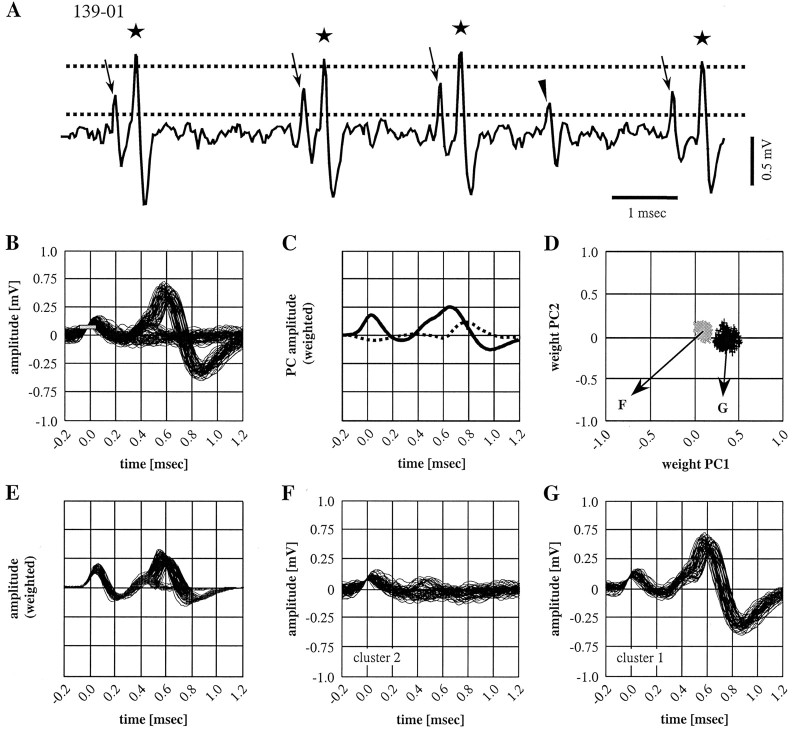
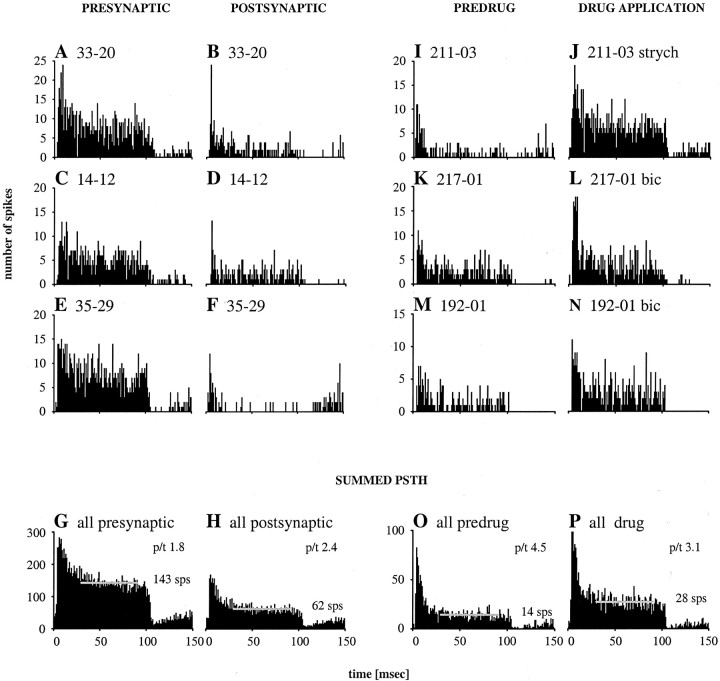
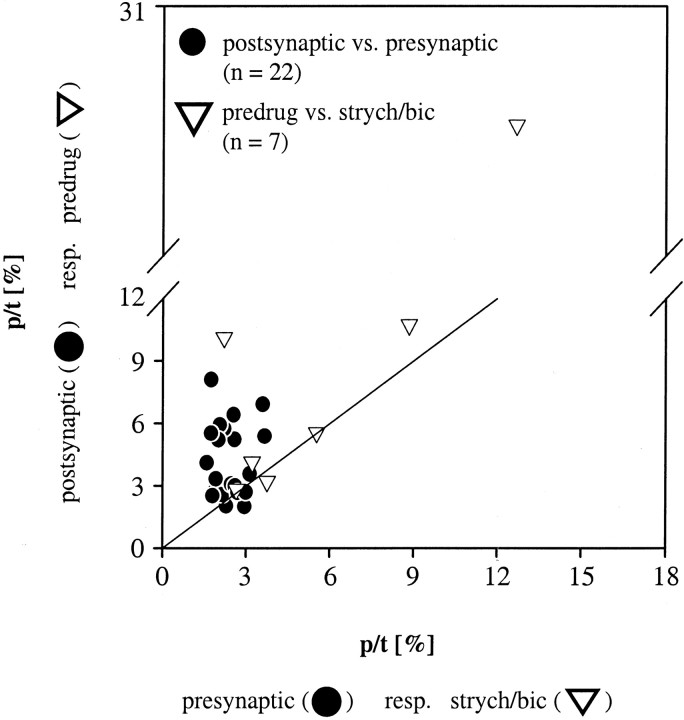
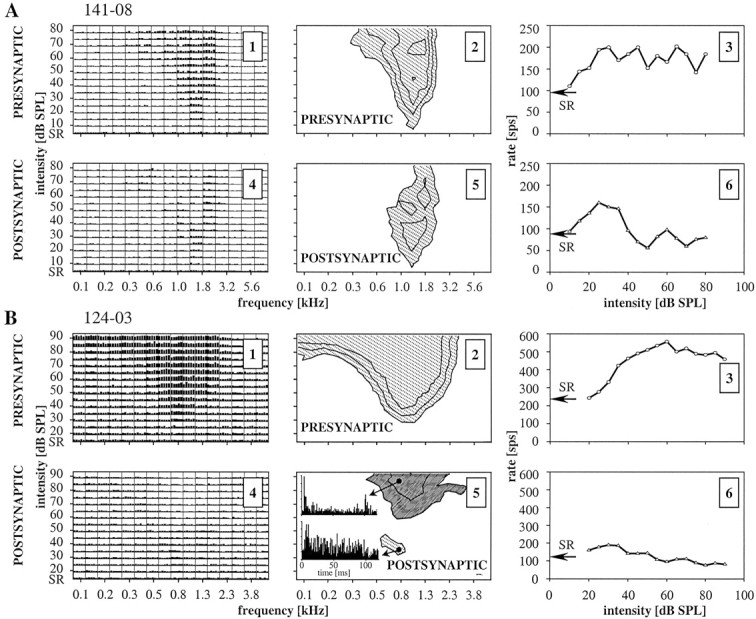
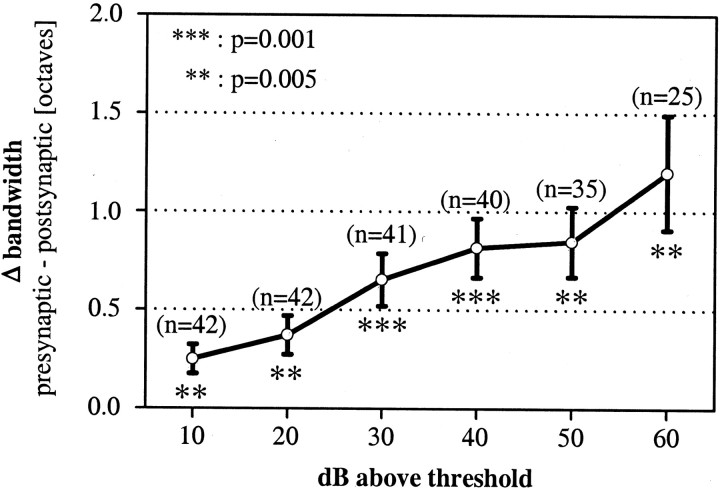
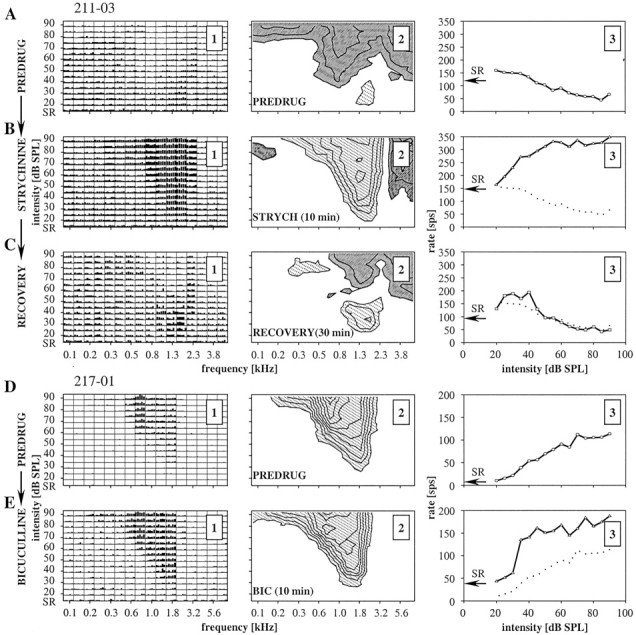
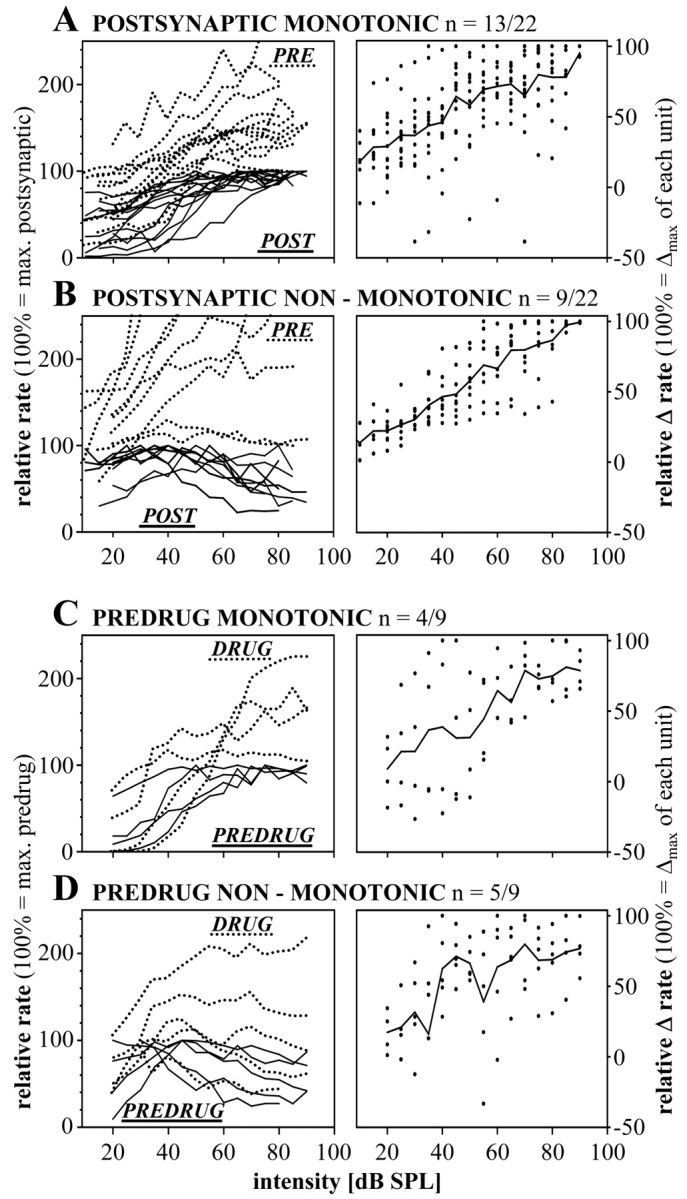
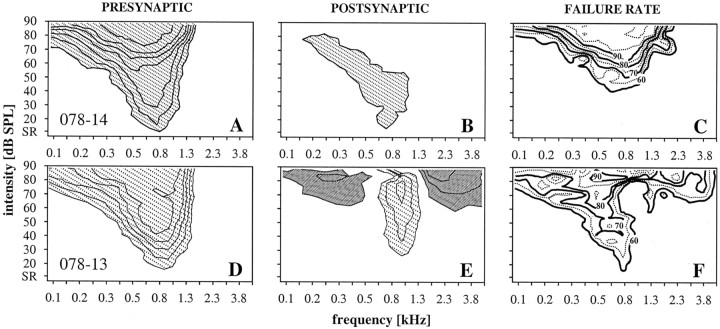
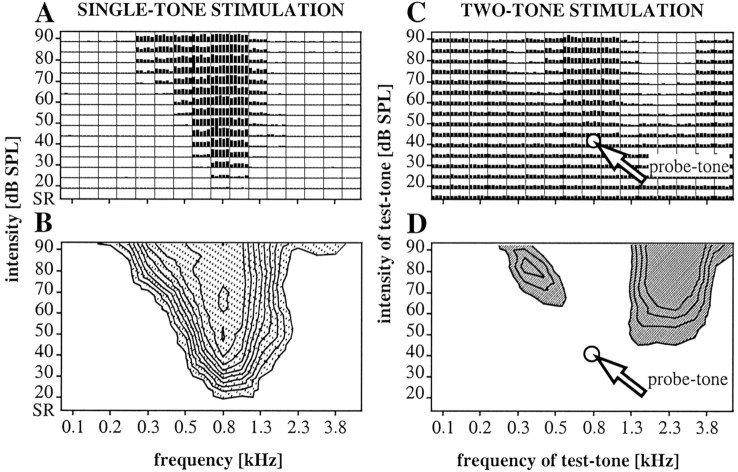
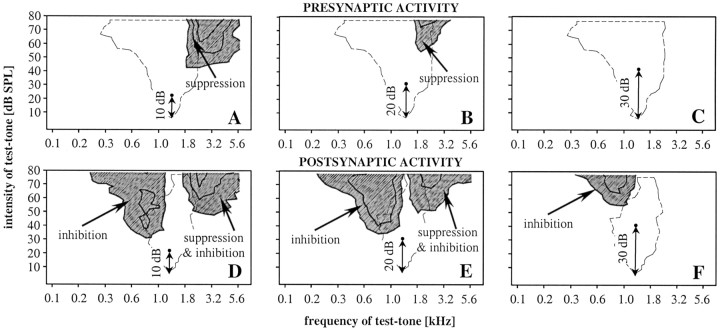
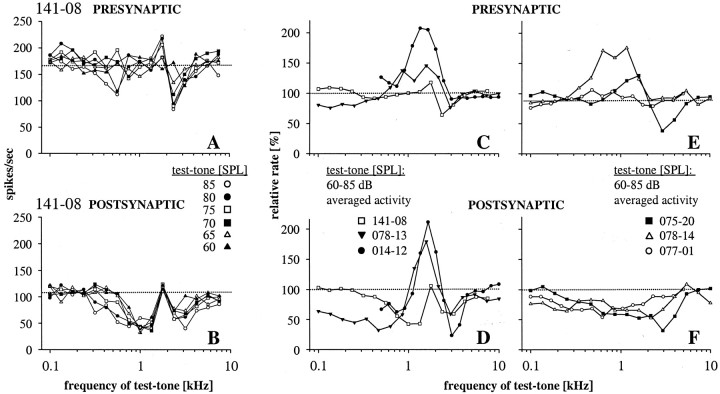
Spherical bushy cells (SBCs) of the anteroventral cochlear nucleus (AVCN) receive their main excitatory input from auditory nerve fibers (ANFs) through large synapses, endbulbs of Held. These cells are also the target of inhibitory inputs whose function is not well understood. The present study examines the role of inhibition in the encoding of low-frequency sounds in the gerbil's AVCN. The presynaptic action potentials of endbulb terminals and postsynaptic action potentials of SBCs were monitored simultaneously in extracellular single-unit recordings in vivo. An input-output analysis of presynaptic and postsynaptic activity was performed for both spontaneous and acoustically driven activity. Two-tone stimulation and neuropharmacological experiments allowed the effects of neuronal inhibition and cochlear suppression on SBC activity to be distinguished. Ninety-one percent of SBCs showed significant neuronal inhibition. Inhibitory sidebands enclosed the high- or low-frequency, or both, sides of the excitatory areas of these units; this was reflected as a presynaptic to postsynaptic increase in frequency selectivity of up to one octave. Inhibition also affected the level-dependent responses at the characteristic frequency. Although in all units the presynaptic recordings showed monotonic rate-level functions, this was the case in only half of the postsynaptic recordings. In the other half of SBCs, postsynaptic inhibitory areas overlapped the excitatory areas, resulting in nonmonotonic rate-level functions. The results demonstrate that the sound-evoked spike activity of SBCs reflects the integration of acoustically driven excitatory and inhibitory input. The inhibition specifically affects the processing of the spectral, temporal, and intensity cues of acoustic signals.


Figures

Fig. 1.
Fig. 1.
Extracellularly recorded tone-evoked neuronal discharges of four AVCN units. AC, Units with PPs [CF: 1.2 kHz (A); 0.8 kHz (B); 1.5 kHz (C)]. Postsynaptic action potentials are marked by asterisks, PPs preceding each action potential are marked byarrows, and isolated PPs are marked byarrowheads. D, Unit lacking PPs (CF: 2.1 kHz). Vertical bars indicate 0.5 mV.
Fig. 2.
Fig. 2.
Separation of presynaptic and postsynaptic signal components (unit 139–01). A, Setting of trigger levels for the acquisition of response maps (see below). Presynaptic and postsynaptic discharge activity can be separated by different thresholds (bottom and top dotted lines). Additionally, a preset dead time of 1 msec prevents double triggers of postsynaptic action potentials after PPs in the PP recordings. Asterisks indicate postsynaptic action potentials; arrows and arrowheadsindicate PPs. BG, Separation of signal constituents using PC analysis. B, Superimposed waveforms of 301 discharges. Trigger level was set to the onset slope of PPs. The gray bar (at 0.12 mV) indicates the upper threshold of the combined threshold and slope criterion.C, The first two PCs (PC1, black line; PC2, dotted line) of the signals shown inB multiplied by their root-mean-square weight. The whole of the signals could be sufficiently described by the first two PCs with an 87% efficiency; i.e., each of the 301 recorded signals can be adequately explained by the weighted sum of two functions, PC1 and PC2.D, On the basis of PC1 and PC2 weights, the potentials are easily separated by a cluster algorithm into two clusters. In this scatter plot, the cluster with the higher PC1 weights (cluster 1,black; n = 233) represents the complex waveforms, and the cluster with the lower PC1 weights (cluster 2, gray; n = 68) identifies the isolated PPs. E, Resynthesis of all 301 signals from the two PC time courses in C and the individual weight pairs in D. The waveforms split up into two subsets, corresponding to either isolated PPs or spike-preceding PPs followed by postsynaptic spikes. F and G show the original waveforms from B related to cluster 1 (spike-preceding PPs followed by postsynaptic spikes) and to cluster 2 (isolated PPs), respectively.
Fig. 3.
Fig. 3.
PSTHs in six primary-like units. Tone bursts of 100 msec at the CFs of the units were presented with 80–90 dB SPL; bin width = 1 msec. A, C,E, PSTHs of presynaptic recordings compared with postsynaptic PSTHs of the respective units (B,D, F). Predrug PSTHs (I, K, M) compared with PSTHs during drug application (J, L,N). Bottom row shows summed-up PSTHs of 22 units (presynaptic/postsynaptic) (G,H) and 7 units (predrug/drug application) (O, P). Average steady-state rates (30–90 msec) are indicated as gray lines and given as sps; peak-over-total values (p/t) are given in the top right corner of each PSTH.strych, Strychnine; bic, bicuculline.
Fig. 4.
Fig. 4.
Peak-over-total ratios (p/t) of the PSTHs for postsynaptic versus presynaptic (●) response, respectively, predrug versus drug application (▵).P/t was calculated as the number of spikes in the first 1 msec bin expressed as a percentage of the total number of spikes in the first 100 msec of the response.
Fig. 5.
Fig. 5.
Comparison of presynaptic (top panels) and postsynaptic (bottom panels) excitatory response areas. For stimulation protocol refer to Materials and Methods. A1,4,B1,4, Spike rates evoked by a single stimulus are indicated by the heights of the bars.A2,5, B2,5, Iso-response contours calculated from the response area shown on theleft. For details see Materials and Methods.A, Unit 141–08; CF, 1.3 kHz. Postsynaptically the excitatory response area is narrower at stimulus levels above 50 dB SPL. B, Unit 124–03; CF, 0.8 kHz. Here, the postsynaptic excitation is reduced to a small circumscribed response area (B5, dotted area). At stimulus levels above 50 dB SPL, a prominent area of inhibition is seen (hatched area) where the presynaptic recording displays excitation. B5,Insets, Primary-like (bottom) and on–off (top) PSTHs within the postsynaptic response area.A3,6, B3,6, Rate-level functions of presynaptic and postsynaptic recordings;SR is indicated by arrows.
Fig. 6.
Fig. 6.
Difference in bandwidth between presynaptic and postsynaptic activity increases with stimulus level. All values (presynaptic vs postsynaptic bandwidth) differed significantly (t test; p value indicated). Because of the different threshold values of the units, the number of tested pairs (n) decreased toward higher levels.
Fig. 7.
Fig. 7.
Pharmacological block of glycinergic and GABAergic inhibition in two SBCs. The design of the graph is the same as Figure5. Dotted lines in B3, C3, and E3 indicate the predrug rate-level functions.AC, Unit 211–03: predrug condition (A); strychnine application (B) (50 nA/3 min); recovery (C) (current of −15 nA for 30 min).D, E, Unit 217–01: predrug condition (D); bicuculline application (E) (25 nA/10 min). STRYCH, Strychnine; BIC, bicuculline.
Fig. 8.
Fig. 8.
Rate-level functions of units with presynaptic (PRE) and postsynaptic (POST) recordings (A, B) (n= 22) or recordings before (PREDRUG) and during (DRUG) drug application (C,D) (n = 9). Rate-level functions were averaged for the CF and two neighboring frequencies. Left column, Each function was normalized to the maximum discharge rate of the postsynaptic or predrug response, respectively (black lines), and compared with the presynaptic or drug response (dotted lines). A, C, Postsynaptic response predrug monotonic rate-level functions;B, D, nonmonotonic rate-level functions.B, Four of the nine units showed an increase in presynaptic discharge rate that exceeded postsynaptic rate by a factor of 2.5. Right column, Differences between presynaptic and postsynaptic responses, respectively, predrug and drug responses of the absolute count data, normalized to the maximum difference of each unit (100%). Values for single units are symbolized by dots; solid lines indicate the running averages.
Fig. 9.
Fig. 9.
Differences between presynaptic and postsynaptic response areas related to the occurrence of isolated PPs.AC, Unit 078–14;DF, unit 078–13; presynaptic (A, D) and postsynaptic (B, E) excitatory response areas. InE the excitatory response area (dotted) is enclosed by inhibitory sidebands (hatched).C, F, Occurrence of isolated PPs indicated as iso-contours of percentage failure rates (60–90%).
Fig. 10.
Fig. 10.
A, Excitatory frequency/intensity response area (design of the graph is same as Fig. 5). This unit had virtually no SR (bottom row). C, Frequency/intensity response area during two-tone stimulation (probe–tone: CF/20 dB above threshold; test-tones varied in the frequency/intensity range indicated by the matrix). The shown spike rates were evaluated over the 40 msec test-tone periods (i.e., 30–70 msec). The probe-tones generated a constant amount of excitation (indicated by equal bar heights in bottom row). In two frequency/intensity domains (flanking the excitatory response area shown in A), the probe-tone-induced discharges were reduced by the test-tones.B, D, Iso-response contours calculated from the response areas shown in A and C;B, dotted: increased activity above SRs;D, hatched: activity reduced below probe-tone-induced discharge rates.
Fig. 11.
Fig. 11.
Distinction between two-tone suppression and neuronal inhibition. All recordings are from unit 141–08.Dashed lines indicate tuning curves for single tone-burst stimulation (for the same unit also shown in Fig.5A2,5). Here, comparable with Figure9E, the maps show the test-tone-induced reduction of the probe-tone-evoked discharges. The probe tone (dot) was presented at the CF (1.3 kHz) at three levels: 10 dB above threshold (A, D), 20 dB above threshold (B, E), and 30 dB above threshold (C, F).
Fig. 12.
Fig. 12.
Iso-intensity curves during two-tone stimulation. A, B, Respective presynaptic and postsynaptic iso-intensity curves for a PP unit; CF, 1.3 kHz; probe-tone, CF/30 dB SPL (= 20 dB above threshold); test-tone intensities as indicated in the graph. The dotted linesspecify the probe-tone-evoked discharge levels.CF, Presynaptic and postsynaptic iso-intensity curves for six PP units; probe-tones at CF, 20 dB above threshold. Spike rates are mean values for 60–85 dB SPL test-tone level. The probe-tone-evoked discharges of the respective units were set to 100%. C, D, Three units with prominent broadband inhibition in their postsynaptic responses that was not seen presynaptically. E, F, Three units with on-CF inhibition. Postsynaptically, the iso-intensity curves show a 25–50% reduction from the probe-tone-evoked discharge level over a wide frequency range of the response area.

Similar articles

Cited by

References

    1. Abeles M, Goldstein MH. Multispike train analysis. Proc IEEE. 1977;65:762–773.
    1. Adams JC. Heavy metal intensification of DAB-based HRP reaction product. J Histochem Cytochem. 1981;29:775. - PubMed
    1. Bazwinsky I, Härtig W, Rübsamen R. Distribution of different calcium binding proteins in the cochlear nucleus of gerbil and opossum (Abstract 260). Presented at Midwinter Meeting of the Association for Research in Otolaryngology. St. Petersburg Beach, FL, February; 1999.
    1. Blackburn CC, Sachs MB. Classification of unit types in the anteroventral cochlear nucleus: PST histograms and regularity analysis. J Neurophysiol. 1989;62:1303–1329. - PubMed
    1. Brawer JR, Morest DK. Relations between auditory nerve endings and cell types in the cat's anteroventral cochlear nucleus seen with the Golgi method and Nomarski optics. J Comp Neurol. 1975;160:491–506. - PubMed

Publication types

LinkOut - more resources