. 2002 Dec 15;22(24):11035-44.
doi: 10.1523/JNEUROSCI.22-24-11035.2002.

High-resolution analysis of ethanol-induced locomotor stimulation in Drosophila

Affiliations

High-resolution analysis of ethanol-induced locomotor stimulation in Drosophila

Fred W Wolf et al. J Neurosci. .

Abstract

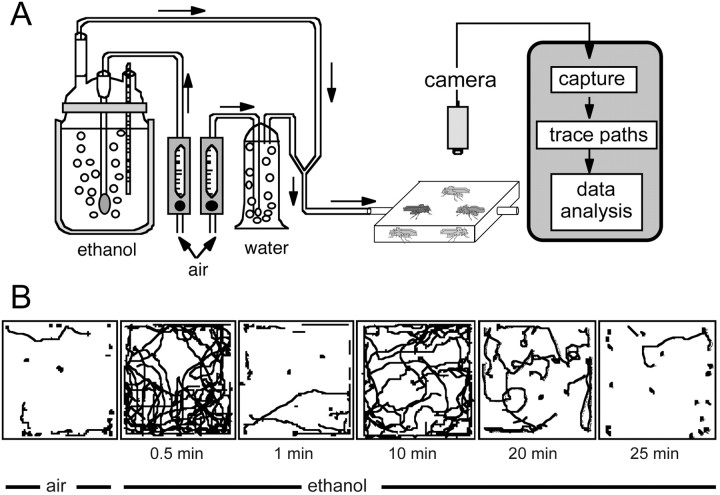
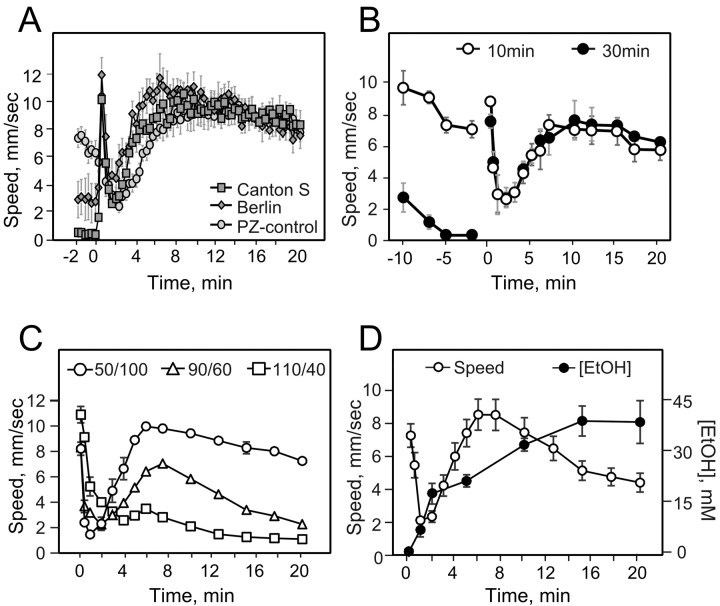
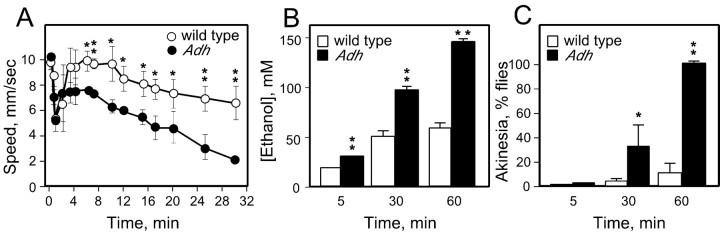
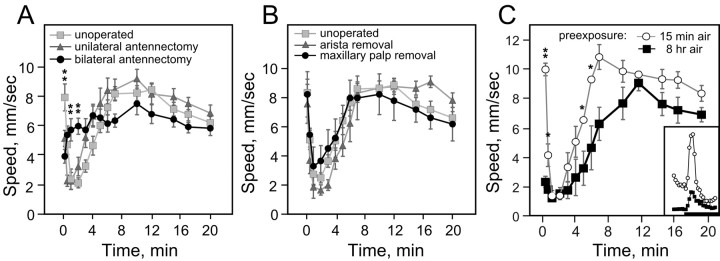
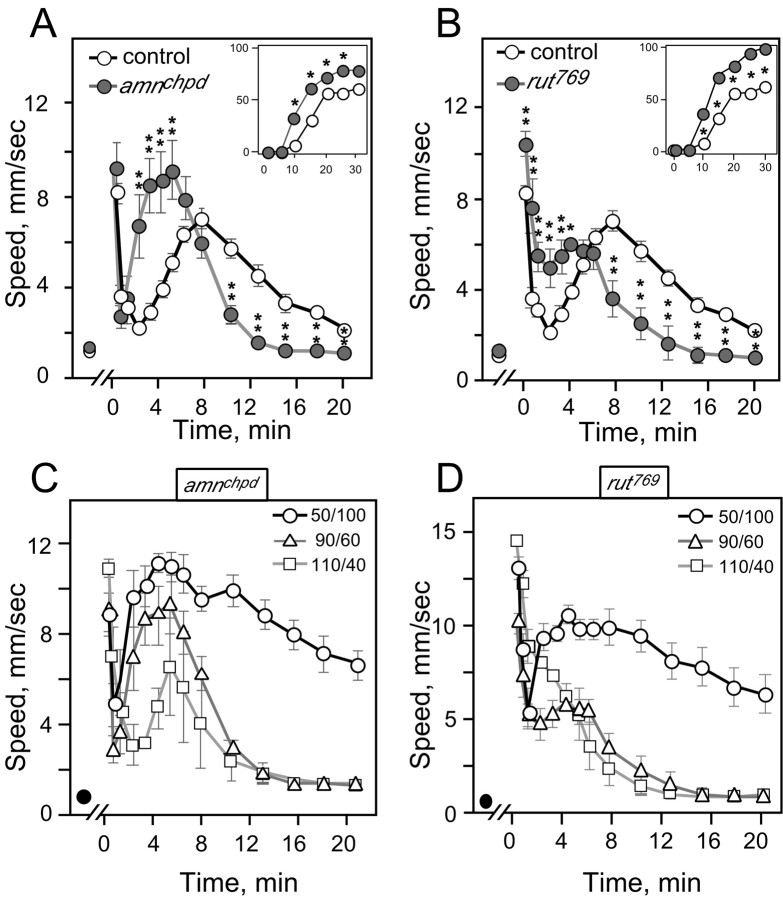
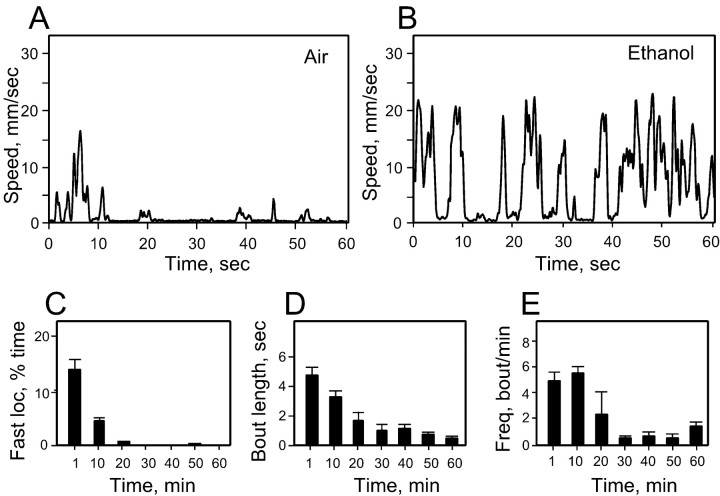
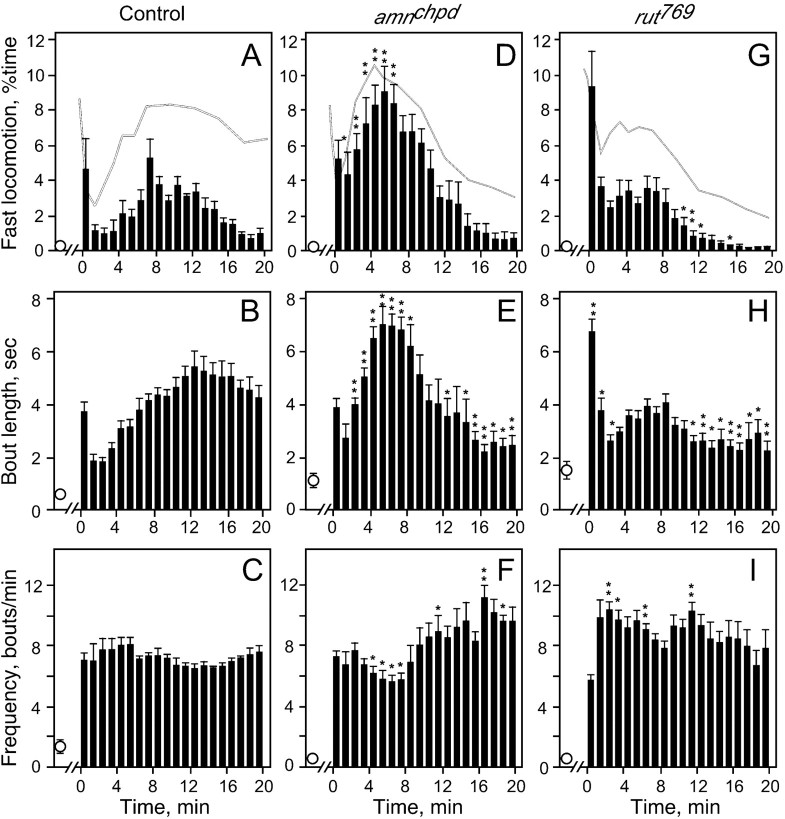
Understanding how ethanol influences behavior is key to deciphering the mechanisms of ethanol action and alcoholism. In mammals, low doses of ethanol stimulate locomotion, whereas high doses depress it. The acute stimulant effect of ethanol has been proposed to be a manifestation of its rewarding effects. In Drosophila, ethanol exposure transiently potentiates locomotor activity in a biphasic dose- and time-dependent manner. An initial short-lived peak of activity corresponds to an olfactory response to ethanol. A second, longer-lasting period of increased activity coincides with rising internal ethanol concentrations; these closely parallel concentrations that stimulate locomotion in mammals. High-resolution analysis of the walking pattern of individual flies revealed that locomotion consists of bouts of activity; bout structure can be quantified by bout frequency, bout length, and the time spent walking at high speeds. Ethanol exposure induces both dramatic and dynamic changes in bout structure. Mutants with increased ethanol sensitivity show distinct changes in ethanol-induced locomotor behavior, as well as genotype-specific changes in activity bout structure. Thus, the overall effect of ethanol on locomotor behavior in Drosophila is caused by changes in discrete quantifiable parameters of walking pattern. The effects of ethanol on locomotion are comparable in flies and mammals, suggesting that Drosophila is a suitable model system to study the underlying mechanisms.


Figures

Fig. 1.
Fig. 1.
Effect of ethanol on locomotion.A, Apparatus for tracking Drosophilalocomotion. Air at controlled flow rates is bubbled through 95% ethanol maintained at 20°C and separately through water. Humidified air and ethanol vapor are mixed and delivered to an exposure chamber made of clear plastic. Flies are filmed with a digital video camera, and video is captured directly onto a computer. Fly motion is detected by frame-to-frame changes in position by the program DIAS. Locomotor velocity and patterns are calculated from the raw data by programs written in Perl. B, Example traces show the path taken by 20 wild-type flies over a 10 sec period at 10 fps at E/A 40:25 in the square chamber. This dose is slightly higher that that used for most experiments and is to reveal the whole range of behaviors seen and recorded by the tracking system. The first panel (air) depicts typical behavior of flies in a stream of humidified air; little locomotion is observed. During switching from air to ethanol vapor, flies show an immediate and transient peak of activity (0.5 min) that subsides by 1 min of exposure. A second more prolonged hyperactive period peaks at ∼10 min of exposure. Locomotor activity is reduced by 20 min of exposure and is almost absent after 25 min. In contrast to the immobile flies seen during air exposure, which are standing and often grooming, immobile flies observed after a 25 min ethanol exposure have lost postural control, are lying on their sides or backs, and are resistant to mechanical stimulation.
Fig. 2.
Fig. 2.
The wild-type hyperactive response is dose sensitive and correlates with ethanol accumulation.A, The wild-type locomotor response to ethanol. Population average walking speed for two wild-type strains (Canton S and Berlin) and a control strain (PZ-control) was calculated for 10 sec periods every 30 sec from 2 min before ethanol exposure onward in the square chamber. Ethanol exposure begins at 0 min in this and all subsequent figures and is continuous for 20 min. Ethanol vapor concentration was E/A 30:35 (n = 3 for each genotype). B, Effect of chamber acclimation on ethanol-induced locomotion. Control flies were allowed to acclimate to the square exposure chamber for 10 or 30 min, and the velocity 10 min before ethanol exposure was calculated. The level of activity before ethanol exposure did not affect ethanol-induced locomotor activity. Ethanol vapor concentration was E/A 30:35 (n = 3).C, Dose dependence of the hyperactive response. Groups of 20 control flies were exposed to the indicated doses of ethanol in the booz-o-mat. Low (E/A 50:100; n = 14), moderate (E/A 90:60; n = 17), and high (E/A 110:40;n = 3) doses are shown. D, Ethanol accumulation. Ethanol concentrations in whole fly extracts were measured while simultaneously determining locomotor velocity in the booz-o-mat at E/A 70:80 (n = 3). Error bars in this and all subsequent figures indicate the SEM.
Fig. 3.
Fig. 3.
Ethanol metabolism affects ethanol-induced hyperactivity. A, Population average locomotor velocities for the wild-type strain Canton S (white circles; n = 3) and Adhmutant flies (black circles) exposed to moderate ethanol doses (E/A 70:80 in the booz-o-mat). Adh is combined data from three transallelic combinations of the Adhmutants Adhfn6,Adhfn23, andAdhn1 (n = 3 for each transallelic pair). All allele combinations produced similar results (control vs Adh; *p < 0.05; **p < 0.01). B, Adhflies show increased concentrations of ethanol, even at 5 min of exposure to moderate ethanol doses (E/A 70:80 in the booz-o-mat) (n = 6; **p < 0.01; two-tailedt test). C, Adh flies became akinetic more quickly than control flies (E/A 70:80 in the booz-o-mat) (n = 9; *p < 0.05; **p < 0.001; two-tailed t test). Akinesis is defined as the number of immobile flies lying on their backs for at least 10 sec at a given time point.
Fig. 4.
Fig. 4.
Sensory input regulates hyperactivity.A, Surgical removal of the third antennal segment affects startle and quiescence, but hyperactivity is relatively normal. The third segment of the bilaterally paired antennae (containing 1200 olfactory neurons) was removed either unilaterally (triangles; n = 6) or bilaterally (circles; n = 7) from control flies (unoperated, squares; n = 11). Unilateral antennectomy reduced startle (p< 0.05) without affecting hyperactivity. Bilateral antennectomy ablated startle (p < 0.01) and increased locomotor activity during quiescence (1 and 2 min;p < 0.01) but only weakly affected hyperactivity at one time point (7 min; p = 0.03). All assays were done in the square chamber at E/A 30:35.B, Other sensory organs are dispensable for ethanol-induced locomotor activation. The aristae project from the third antennal segment and were removed in the third antennal segment surgery. Maxillary palps are a second olfactory organ with 120 olfactory receptor neurons (n = 4).C, Long acclimation periods abolish startle but maintain hyperactivity. Control flies were preexposed to humidified air for 15 min (circles; n = 3) or 8 hr (squares; n = 4) and then exposed to ethanol for 20 min (E/A 30:35). Locomotor activity was strongly different between conditions after 10 sec (9.4 vs 1.9 mm/sec;p = 0.0003) and weakly different at 30 sec, 6 min, and 7 min (p < 0.05). Inset, Startle response at high temporal resolution. Speed was sampled every 5 sec and averaged over 5 sec.
Fig. 5.
Fig. 5.
Ethanol sensitivity mutants have genotype-specific defects in ethanol-induced hyperactivity. A,B, Comparison of mutant (n = 5) with control (n = 17; data same as in Fig.2C) flies at a moderate ethanol dose (E/A 90:60) in the booz-o-mat. Insets show the time course for akinesia in the same experiments: the number of immobile flies lying on their backs for at least 10 sec (expressed as percentage of total flies;y-axis) was counted at the given times (in minutes;x-axis). *p < 0.05; **p < 0.01. C, D, Ethanol sensitivity mutant dose responses. Low ethanol dose corresponds to E/A 50:100 (circles; n = 7), moderate dose to E/A 90:60 (triangles;n = 5), and high dose to E/A 110:40 (squares; n = 3). As for wild-type flies (Fig. 2C), lower ethanol doses stimulate locomotion, whereas higher doses are sedating. Baseline locomotor activity for each genotype (circles in the bottom left corner of each panel) was obtained after a 30 min acclimation period, a time when locomotor activity had stabilized.
Fig. 6.
Fig. 6.
Patterns of locomotor activity. Representative traces of the speed of a single fly over 1 min exposure to humidified air (A) and ethanol (B) (E/A 30:35 in the square chamber). Fly speed was sampled 10 times per second over the course of 1 min. C–E, Measures of activity bout structure as flies acclimate to their environment in a stream of humidified air. Percentage of time spent moving at speeds >20 mm/sec (C), activity bout length (D), and activity bout frequency (E). For each measure, data sampled at 10 fps was averaged across a 1 min time interval for 20 flies (n = 3; E/A 0:65 in the square chamber).
Fig. 7.
Fig. 7.
Locomotor activity patterns of control flies and of ethanol-sensitive mutants during ethanol exposure. Time spent moving at speeds >20 mm/sec (fast locomotion; top row), activity bout length (middle row), and activity bout frequency (bottom row). For each measure of locomotor pattern, data sampled at 10 fps was averaged across 1 min time intervals for populations of 20 flies (E/A 30:35; n= 8). Superimposed on the fast locomotion panels are the population average locomotor velocities for each genotype derived from the same dataset. The activity bout structure for flies acclimated to the exposure chamber in a stream of humidified air for 50 min is indicated by an open circle to the left of the ethanol exposure data (n = 3). A–C, Control strain PZ-control. D–F,amnchpd. G–I,rut769. For control flies, exposure to ethanol resulted in significant increases over baseline for all three measures (p < 0.0001 compared with the first minute of ethanol exposure for each measure). During continuous ethanol exposure, fast locomotion and activity bout length changed significantly over time (p < 0.0001), whereas bout frequency did not (p = 0.46).Asterisks in D–F correspond to comparisons of control versus amnchpd, and asterisks in G–I correspond to comparisons of control versus rut769(*p < 0.05; **p < 0.01).

Similar articles

Cited by

References

    1. Aceves PE, Booker R, Duerr JS, Livingstone MS, Quinn WG, Smith RF, Sziber PP, Tempel BL, Tully TP. Learning and memory in Drosophila, studied with mutants. Cold Spring Harb Symp Quant Biol. 1983;2:831–840. - PubMed
    1. Bainton RJ, Tsai LT-Y, Singh CM, Moore MS, Neckameyer WS, Heberlein U. Dopamine modulates acute responses to cocaine, nicotine, and ethanol in Drosophila. Curr Biol. 2000;10:187–194. - PubMed
    1. Brandon EP, Logue SF, Adams MR, Qi M, Sullivan SP, Matsumoto AM, Dorsa DM, Wehner JM, McKnight GS, Idzerda RL. Defective motor behavior and neural gene expression in RIIβ-protein kinase A mutant mice. J Neurosci. 1998;18:3639–3649. - PMC - PubMed
    1. Cunningham CL, Howard MA, Gill SJ, Rubinstein M, Low MJ, Grandy DK. Ethanol-conditioned place preference is reduced in dopamine D2 receptor-deficient mice. Pharmacol Biochem Behav. 2000;67:693–699. - PubMed
    1. de Bruyne M, Foster K, Carlson JR. Odor coding in the Drosophila antenna. Neuron. 2001;30:537–552. - PubMed

Publication types

LinkOut - more resources