. 2002 Dec 24;99(26):16875-80.
doi: 10.1073/pnas.252466999. Epub 2002 Dec 16.

Genome-wide coexpression dynamics: theory and application

Affiliations

Genome-wide coexpression dynamics: theory and application

Ker-Chau Li. Proc Natl Acad Sci U S A. .

Abstract

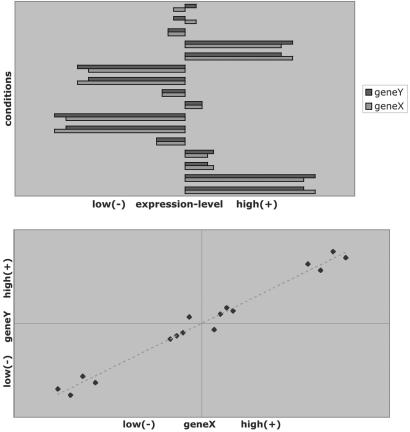
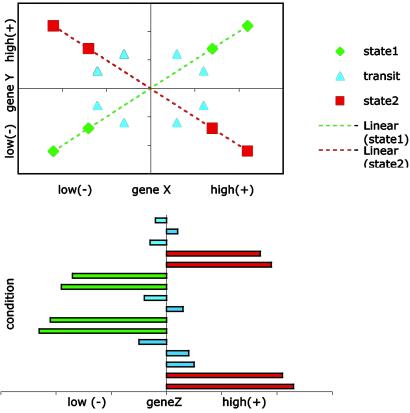
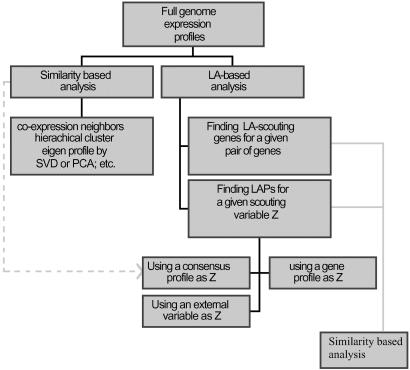
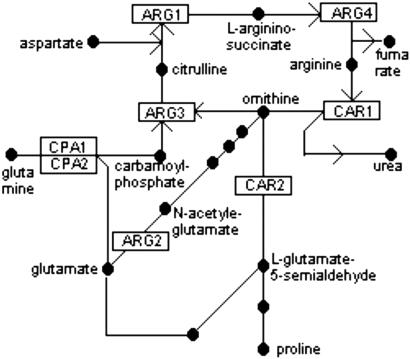
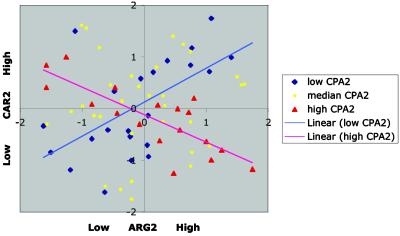
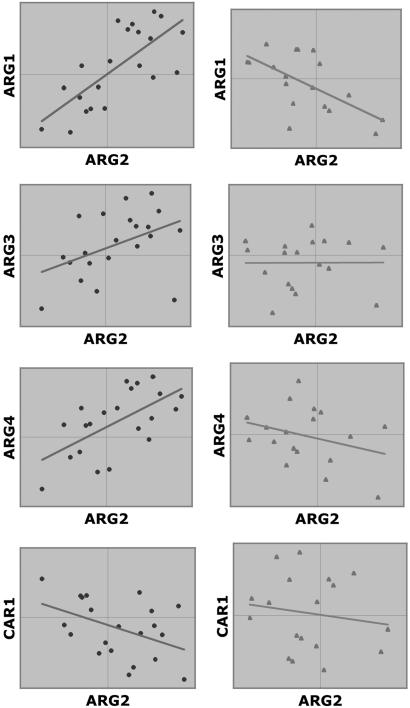
High-throughput expression profiling enables the global study of gene activities. Genes with positively correlated expression profiles are likely to encode functionally related proteins. However, all biological processes are interlocked, and each protein may play multiple cellular roles. Thus the coexpression of any two functionally related genes may depend on the constantly varying, yet often-unknown cellular state. To initiate a systematic study on this issue, a theory of coexpression dynamics is presented. This theory is used to rationalize a strategy of conducting a genome-wide search for the most critical cellular players that may affect the coexpression pattern of any two genes. In one example, using a yeast data set, our method reveals how the enzymes associated with the urea cycle are expressed to ensure proper mass flow of the involved metabolites. The correlation between ARG2 and CAR2 is found to change from positive to negative as the expression level of CPA2 increases. This delicate interplay in correlation signifies a remarkable control on the influx and efflux of ornithine and reflects well the intrinsic cellular demand for arginine. In addition to the urea cycle, our examples include SCH9 and CYR1 (both implicated in a recent longevity study), cytochrome c1 (mitochondrial electron transport), calmodulin (main calcium-binding protein), PFK1 and PFK2 (glycolysis), and two genes, ECM1 and YNL101W, the functions of which are newly revealed. The complexity in computation is eased by a new result from mathematical statistics.


Figures

Fig 1.
Fig 1.
Profile similarity. (Upper) Profiles of genes X and Y under 16 conditions. (Lower) The same data is shown in a scatter plot: one point for one condition. Coexpressed genes have most points on either the first (coactivated) or third (co-inactivated) quadrant. The strength of the coexpression pattern can be measured by correlation coefficient, which equals (X1Y1 +⋯+ XmYm)/m after standardization of each profile. On the other hand, X and Y are contraexpressed if most points are on the other two quadrants, meaning that when one gene is up-regulated, the other gene is down-regulated; the correlation coefficient is negative. However, contraexpression is rarely discussed in the literature.
Fig 2.
Fig 2.
Coexpression dynamics. (Upper) Profiles of genes X and Y are displayed in a scatter plot. The four green points represent four conditions for cellular state 1 wherein X and Y are coregulated. Likewise, the four red points represent four conditions for cellular state 2 wherein X and Y are contraexpressed. To depict this kind of internal evolution in the association pattern, we say (X,Y) forms a LAP. Because the relevant cellular states usually are unknown, it is hard to detect LAP directly from the profiles of X and Y alone. However, if the cellular states are correlated with the differential expression of a third gene Z, then we can use Z to scout (X,Y) for information about their LA activity. (Lower) The four green bars represent the expression of Z for the same four green-colored conditions as shown in Upper. Likewise, the four red bars correspond to the four red-colored conditions shown in Upper. We see when Z is down-regulated (green), X and Y are coexpressed; when Z is up-regulated (red), X and Y become contraexpressed. We assign a score to quantify the strength of LA. The LA score for this illustration is a negative value. On the other hand, if the low expressions of Z correspond to the red points shown in Upper and the high expressions of Z correspond to the green points shown in Upper, then the LA score will be positive.
Fig 3.
Fig 3.
Organization chart for incorporating LA with similarity-based methods. In this article, we only consider the use of a third gene to detect the LA activities. Coexpressed genes found by profile-similarity analysis can be pooled to obtain a consensus profile for LA scouting. Likewise, the genes identified through the LA system can be analyzed further for patterns of clustering. For some applications, the scouting variable may come from external sources related to the expression profiles. SVD, singular value decomposition; PCA, principal component analysis.
Fig 4.
Fig 4.
Urea cycle/arginine biosynthesis pathway. ARG2 encodes acetyl-glutamate synthase, which catalyzes the first step in synthesizing ornithine from glutamate. Ornithine and carbamoyl phosphate are the substrates of the enzyme ornithine transcarbamoylase, encoded by ARG3. Carbamoyl phosphate synthetase is encoded by CPA1 and CPA2. ARG1 encodes argininosuccinate synthetase, ARG4 encodes argininosuccinase, CAR1 encodes arginase, and CAR2 encodes ornithine aminotransferase.
Fig 5.
Fig 5.
LA between ARG2 and CAR2 as scouted by CPA2. When the expression level of CPA2 is low (conditions represented by blue diamonds), a positive correlation is seen between ARG2 and CAR2. As the level of CPA2 increases, the correlation pattern is gradually weakened. Eventually, when CPA2 is high (red triangle), the association is turned into negative. The LA score is −0.289. For efficient activation of the arginine biosynthesis pathway, up-regulation of ARG2 must be concomitant with down-regulation of CAR2 to prevent ornithine from leaking out of the urea cycle. We see that this occurs only when CPA2 is up-regulated. Because activation of CPA2 provides the influx of carbamoyl phosphate into the urea cycle, a high expression level of CPA2 can be interpreted as a physiological signal for arginine demand. When the demand is relieved and CPA2 is lowered, CAR2 is up-regulated, opening up the channel for ornithine to leave the urea cycle.
Fig 6.
Fig 6.
Coherent expression of urea-cycle genes is mediated by SCH9. When SCH9 is low (Left), all four ARG genes are coexpressed, and CAR1 is contraexpressed with ARG2. Thus, as ARG2 is activated, CAR1 is concomitantly down-regulated, which ensures that the newly synthesized arginine will not be subject to the immediate hydrolysis by arginase. Low SCH9 is concomitant with the down-regulation of CAR2 (Fig. 8 Lower), further shutting down the outlet for ornithine to leave the urea cycle. In contrast, when SCH9 is high (Right), the coherence disappears, some showing no correlation and others displaying negative correlation.

References

    1. Spellman P. T., Sherlock, G., Zhang, M. Q., Iyer, V. R., Anders, K., Eisen, M. B., Brown, P. O., Botstein, D. & Futcher, B. (1998) Mol. Biol. Cell 9, 3273-3297. - PMC - PubMed
    1. Alon U., Barkai, N., Notterman, D. A., Gish, K., Ybarra, S., Mack, D. & Levine, A. J. (1999) Proc. Natl. Acad. Sci. USA 96, 6745-6750. - PMC - PubMed
    1. Scherf U., Ross, D. T., Waltham, M., Smith, L. H., Lee, J. K., Tanabe, L., Kohn, K. W., Reinhold, W. C., Myers, T. G., Andrews, D. T., et al. (2000) Nat. Genet. 24, 236-244. - PubMed
    1. Bhattaxharjee A., Richards, W. G., Staunton, J., Li, C., Monti, S., Vasa, P., Ladd, C., Beheshti, J., Bueno, R., Gillette, M., et al. (2001) Proc. Natl. Acad. Sci. USA 98, 13790-13795. - PMC - PubMed
    1. Giordano T. J., Shedden, K. A., Schwartz, D. R., Kuick, R., Taylor, J. M. G., Lee, N., Misek, D. E., Greenson, J. K., Kardia, S. L. R., Beer, D. G., et al. (2001) Am. J. Pathol. 159, 1231-1238. - PMC - PubMed

Publication types

LinkOut - more resources