. 2002 Dec 24;99(26):17185-90.
doi: 10.1073/pnas.262372999. Epub 2002 Dec 16.

Engineered calmodulins reveal the unexpected eminence of Ca2+ channel inactivation in controlling heart excitation

Affiliations

Engineered calmodulins reveal the unexpected eminence of Ca2+ channel inactivation in controlling heart excitation

Badr A Alseikhan et al. Proc Natl Acad Sci U S A. .

Abstract

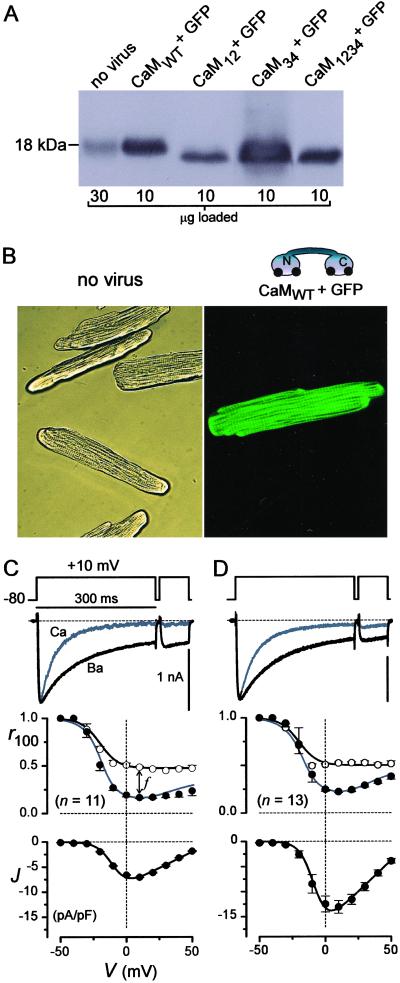
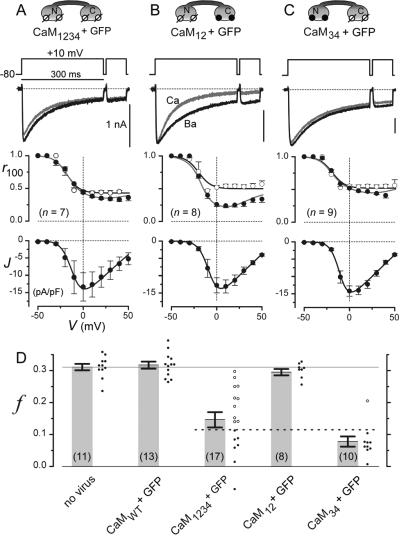
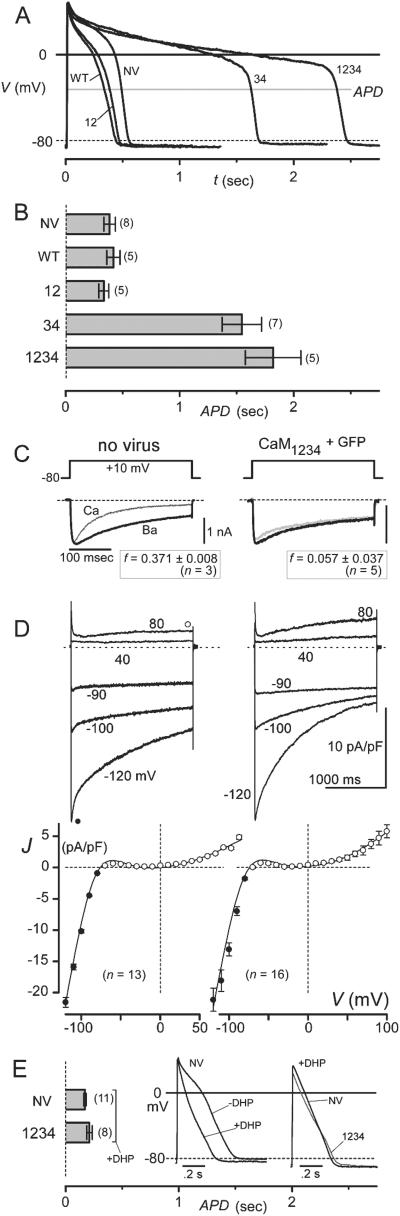
Engineered calmodulins (CaMs), rendered Ca2+-insensitive by mutations, function as dominant negatives in heterologous systems, and have revealed mechanisms of ion channel modulation by Ca2+/CaM. The use of these CaMs in native mammalian cells now emerges as a strategy to unmask the biology of such Ca2+ feedback. Here, we developed recombinant adenoviruses bearing engineered CaMs to facilitate their expression in adult heart cells, where Ca2+ regulation may be essential for moment-to-moment control of the heartbeat. Engineered CaMs not only eliminated the Ca2+-dependent inactivation of native calcium channels, but exposed an unexpectedly large impact of removing such feedback: the unprecedented (4- to 5-fold) prolongation of action potentials. This striking result recasts the basic paradigm for action-potential control and illustrates the promise of virally delivered engineered CaM to investigate the biology of numerous other CaM-signaling pathways.


Figures

Fig 1.
Fig 1.
Delivery of engineered CaMs to myocytes. (A) CaM Western blots from rat cardiocytes (9), cultured for 2 d after infection. Lysate amount per lane is indicated at the bottom. (B) Micrographs (×400) relating to A, with uninfected cells in bright-field (Left) and cells with AdIR-CaM under fluorescence (Right). (C and D) L-type channels in cells relating to those in B. (Top) Exemplar currents with Ca2+ (gray) or Ba2+ (black) as the charge carrier. The Ca2+ trace was amplified ≈×3 to match the Ba2+ traces; scale bars for Ba2+. (Middle) Mean CDI properties shown by Ca2+ and Ba2+ r100 curves, and the average of n cells. f is defined at +10 mV. ○, Ba2+; •, Ca2+. (Bottom) Peak current density, with Ca2+, the mean from the same n cells. GFP inexplicably enhanced the current.
Fig 2.
Fig 2.
Engineered CaMs eliminate native L-type channel CDI. (AC) L-type channel properties in rat cells with engineered CaMs, drawn at the top. The format used here is the same as in Fig. 1C. The means are from cells relating to solid circles in D. ○, Ba2+; •, Ca2+. (D) The bars show population CDI properties, reflected by f (see Fig. 1C). Associated cell-by-cell scattergram are shown. Dotted line, f cutoff for inclusion in the means of A and C. The left two bars relate to Fig. 1 C and D.
Fig 3.
Fig 3.
Ultralong action potentials in guinea pig myocytes lacking CDI. (A) Exemplar action potentials (APs) in uninfected cells (NV), and in cells with AdIR-CaMs (WT, CaMWT+GFP; 12, CaM12+GFP; 34, CaM34+GFP; 1234, CaM1234+GFP). Gray line, voltage for APD (APD) measurement. Waveform differences for WT, 12, and NV illustrate variability observable within any one of groups; group means are statistically indistinguishable in B. Likewise, 34 and 1234 exemplars illustrate variability present in either group; there is no statistical difference of groups means in B. (B) Mean APDs, from populations relating to exemplars in A. APDs for NV, WT, and 12 were statistically indistinguishable, as were those for 34 and 1234. APD differences between these two groups were significant. (C) Engineered CaMs eliminate CDI in guinea pig cells. Exemplar L-type currents from uninfected cells (Left), and those with AdIR-CaM1234 (Right); format is as in Fig. 1C Top. Mean f below indicates approximately complete elimination of CDI by CaM1234. (D) No K current change by engineered CaMs in guinea pig cells. (Left), Uninfected cells. (Right) Cells with AdIR-CaM1234. (Upper) Exemplar K currents during steps to marked voltages, from −70 mV holding potential. (Lower) K current-voltage curves, averaged from n cells in each population. •, Peak K currents at voltage-pulse onset; ○, K currents at end of 2-s pulses. (E) No APD prolongation by CaM1234 with nimodipine (10 μM). Bar graph, format as in B; APDs with nimodipine are significantly shorter than counterparts in B; there is no statistical difference between NV and 1234 in E. (Left Inset) AP in NV exemplar cell, ±nimodipine (±DHP). (Right Inset), exemplar NV and 1234 (gray) APs with nimodipine.
Fig 4.
Fig 4.
Graph IT analysis implicates CDI as dominant APD control factor. (A) Schematic of prototypic “normal” and “ultralong” action potentials (APs). Labeled time, voltage, and waveform landmarks relate to analysis in BD. (B) Formulation of IT analysis. (Left) Aggregate current–voltage relation for non-L-type current (INL), equal to sum of curves for K channels (IK) and Na/Ca exchanger (INCX). All relations here and throughout the figure are schematized for conceptual clarity. (Right) Aggregate current–voltage relation for entire cell (IT), equal to sum of INL (from left) and L-type channel (IL) relations. IT zero-crossing points predict resting potential (r), threshold potential (t), and plateau of action potential (p). (C) Dominant (L-type channel) CDI case. (Left) Main time-dependent change during latter plateau of normal AP is CDI, yielding a smaller IL(te) than IL(tp), and invariant INL. (Right) Summing IL(tp) and INL yields IT(tp), relating to normal AP plateau in A. Adding IL(te) and INL yields IT(te), signaling termination of normal AP in A (point e). (D) Dominant K activation scenario. (Left) Main time-dependent change during latter plateau is K channel activation, yielding much larger INL(te) than INL(tp), and slight decrease of IL(te) vs. IL(tp). (Right) Summing IL(tp) and INL(tp) produces IT(tp), predicting normal AP plateau in A. Adding IL(te) and INL(te) produces IT(te), precipitating termination of plateau in A (point e).

References

    1. Jurado L. A., Chockalingam, P. S. & Jarrett, H. W. (1999) Physiol. Rev. 79, 661-682. - PubMed
    1. DeMaria C. D., Soong, T. W., Alseikhan, B. A., Alvania, R. S. & Yue, D. T. (2001) Nature 411, 484-489. - PubMed
    1. Hoeflich K. P. & Ikura, M. (2002) Cell 108, 739-742. - PubMed
    1. Dasgupta M., Honeycutt, T. & Blumenthal, D. K. (1989) J. Biol. Chem. 264, 17156-17163. - PubMed
    1. Imredy J. P. & Yue, D. T. (1994) Neuron 12, 1301-1318. - PubMed

Publication types