

Crop pollination from native bees at risk from agricultural intensification
- PMID: 12486221
- PMCID: PMC139226
- DOI: 10.1073/pnas.262413599
Crop pollination from native bees at risk from agricultural intensification
Abstract
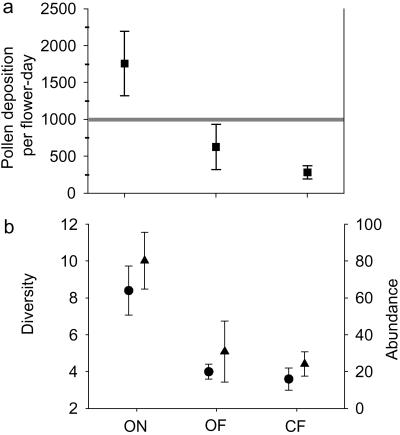
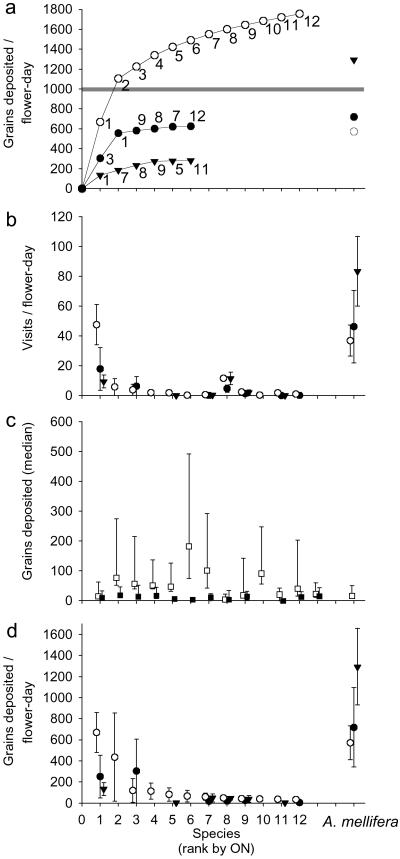
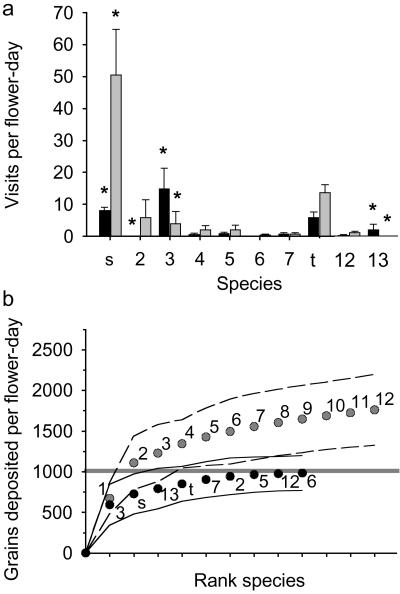
Ecosystem services are critical to human survival; in selected cases, maintaining these services provides a powerful argument for conserving biodiversity. Yet, the ecological and economic underpinnings of most services are poorly understood, impeding their conservation and management. For centuries, farmers have imported colonies of European honey bees (Apis mellifera) to fields and orchards for pollination services. These colonies are becoming increasingly scarce, however, because of diseases, pesticides, and other impacts. Native bee communities also provide pollination services, but the amount they provide and how this varies with land management practices are unknown. Here, we document the individual species and aggregate community contributions of native bees to crop pollination, on farms that varied both in their proximity to natural habitat and management type (organic versus conventional). On organic farms near natural habitat, we found that native bee communities could provide full pollination services even for a crop with heavy pollination requirements (e.g., watermelon, Citrullus lanatus), without the intervention of managed honey bees. All other farms, however, experienced greatly reduced diversity and abundance of native bees, resulting in insufficient pollination services from native bees alone. We found that diversity was essential for sustaining the service, because of year-to-year variation in community composition. Continued degradation of the agro-natural landscape will destroy this "free" service, but conservation and restoration of bee habitat are potentially viable economic alternatives for reducing dependence on managed honey bees.
Figures
References
-
- Daily G. C., (1997) Nature's Services: Societal Dependence on Natural Ecosystems (Island, Washington, DC).
-
- Heal G., (2000) Nature and the Marketplace: Capturing the Value of Ecosystem Services (Island, Covelo, CA).
-
- Kremen C., Niles, J. O., Dalton, M. G., Daily, G. C., Ehrlich, P. R., Fay, J. P., Grewal, D. & Guillery, R. P. (2000) Science 288, 1828-1832. - PubMed
-
- Balvanera P., Daily, G. C., Ehrlich, P. R., Ricketts, T. H., Bailey, S. A., Kark, S., Kremen, C. & Pereira, H. (2001) Science 291, 2047-2047. - PubMed
Publication types
MeSH terms
LinkOut - more resources
Full Text Sources
