. 2002 Dec 24;99(26):16992-7.
doi: 10.1073/pnas.012479199. Epub 2002 Dec 16.

Hyperinsulinism induced by targeted suppression of beta cell KATP channels

Affiliations

Hyperinsulinism induced by targeted suppression of beta cell KATP channels

J C Koster et al. Proc Natl Acad Sci U S A. .

Abstract

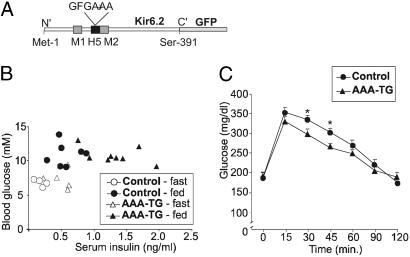
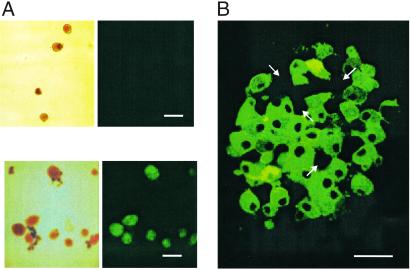
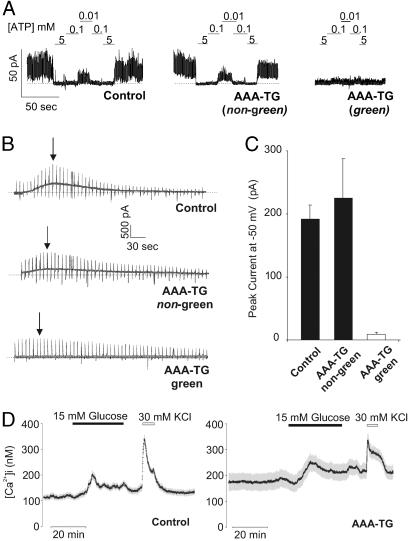
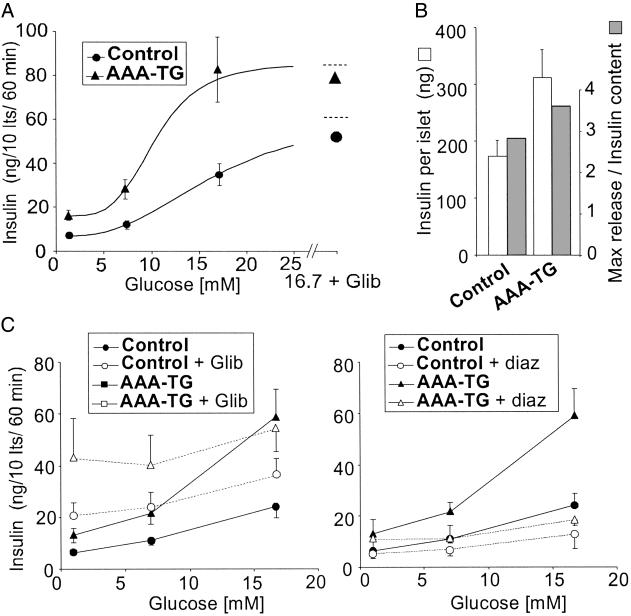
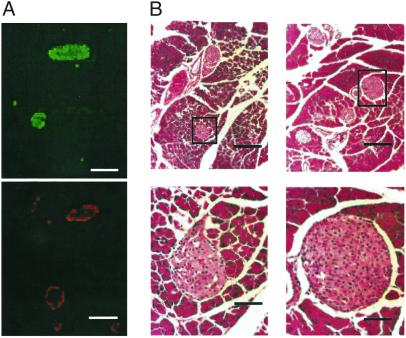
ATP-sensitive K+ (K(ATP)) channels couple cell metabolism to electrical activity. To probe the role of K(ATP) in glucose-induced insulin secretion, we have generated transgenic mice expressing a dominant-negative, GFP-tagged K(ATP) channel subunit in which residues 132-134 (Gly-Tyr-Gly) in the selectivity filter were replaced by Ala-Ala-Ala, under control of the insulin promoter. Transgene expression was confirmed by both beta cell-specific green fluorescence and complete suppression of channel activity in those cells ( approximately 70%) that did fluoresce. Transgenic mice developed normally with no increased mortality and displayed normal body weight, blood glucose levels, and islet architecture. However, hyperinsulinism was evident in adult mice as (i) a disproportionately high level of circulating serum insulin for a given glucose concentration ( approximately 2-fold increase in blood insulin), (ii) enhanced glucose-induced insulin release from isolated islets, and (iii) mild yet significant enhancement in glucose tolerance. Enhanced glucose-induced insulin secretion results from both increased glucose sensitivity and increased release at saturating glucose concentration. The results suggest that incomplete suppression of K(ATP) channel activity can give rise to a maintained hyperinsulinism.


Figures

Fig 1.
Fig 1.
Hyperinsulinism in AAA-TG mice. (A) Schematic of the Kir6.2 subunit. The ion-selectivity pore sequence (132GFG134) in H5 was replaced with –AAA–, and GFP was fused to the C terminus. For transgenic expression, this Kir6.2[AAA]-GFP construct was placed downstream of the rat insulin promoter (RIP-I) driving expression in beta cells. (B) Blood sugar vs. insulin levels during both fasting (16 h) and fed states for control and AAA-TG mice aged 4–8 months. Each symbol represents a different animal. (C) Glucose-tolerance test results for control and Kir6.2[AAA] male mice age 4–8 months. After administration of glucose load (1.5 g/kg), blood samples from the tail vein were taken at the times indicated and assayed for blood glucose content (*, P < 0.05, two-tailed Student's t test).
Fig 2.
Fig 2.
GFP fluorescence from isolated transgenic islets indicates variegated expression of the Kir6.2[AAA] transgene. (A) Clear field and fluorescent images of isolated control (Upper) and AAA-TG (Lower) islets. (B) Representative confocal image (Z section) from a transgenic AAA-TG islet. Arrows denote predicted pancreatic beta cells that do not express the transgene, based on lack of GFP fluorescence. [Scale bars: 100 μm (A) and 10 μm (B).]
Fig 3.
Fig 3.
Green fluorescing AAA-TG beta cells exhibit no detectable KATP channel activity and elevated [Ca2+]i. (A) Representative KATP currents recorded in inside-out membrane patches from littermate control and AAA-TG beta cells. Patches were exposed to differing ATP concentration as shown. A heterogeneous population of beta cells was observed in the transgenic islets with no KATP channel activity in the beta cells expressing Kir6.2[AAA]-GFP (green, ≈70%) and the remaining cells (nongreen, ≈30%) displaying wild-type KATP channels, with respect to channel density and ATP sensitivity. (B) Representative macroscopic K+ current recorded from whole beta cells after dialysis with zero ATP solution (0.5-s ramps from −90 mV to +20 mV delivered every 5 s; holding potential, −50 mV). Peak currents for representative traces are indicated (arrows). (C) Averaged peak K+ currents at −50 mV for AAA-TG (green, n = 8; nongreen, n = 4) and control beta cells. (D) Representative recordings of [Ca2+]i (symbols; ±SEM) for multiple cells in a field (n = 28 and 35, respectively) from a single AAA-TG or control mouse. Cells were exposed to 3 mM glucose or 15 mM glucose, or 30 mM KCl, as indicated. Qualitatively similar results were observed in beta cells from three additional pairs of control and AAA-TG mice.
Fig 4.
Fig 4.
AAA-TG islets hypersecrete insulin. (A) Glucose dependence of insulin secretion from AAA-TG and control islets (n = 17 and 15, respectively) isolated from adult (2–24 months) mice. Also indicated are data obtained in the presence of 16.7 mM glucose plus 1 μM glibenclamide to estimate maximal release (n = 7 and 8). The curves are fits of the Hill equation with an offset, with K1/2 (glucose concentration giving half-maximal stimulated release) = 16.7 and 10.3 mM, and Hill coefficient of 2.7 and 4.3 for control and AAA-TG islets, respectively. (B) Insulin content per islet for control and AAA-TG mice (open bars; mean ± SEM; n = 34 and 32), and the ratio of maximal release rate (16.7 mM glucose + glibenclamide) to content (filled bars). (C) Glucose dependence of insulin secretion from AAA-TG and control islets (n = 3–6) in the presence or absence of 1 μM glibenclamide or 250 μM diazoxide (paired experiments).
Fig 5.
Fig 5.
Hyperinsulinemic AAA-TG islets have normal morphology. (A) Representative immunofluorescence of consecutive serial sections of AAA-TG pancreas (5 months) incubated with antiinsulin (Upper) or antiglucagon (Lower) antibodies. Insulin-containing beta cells form the core of the islet, whereas glucagon-positive alpha cells are found in the periphery, indicating normal islet morphology. (B) Representative hematoxylin and eosin staining of pancreatic sections from control (Left) and AAA-TG (Right) mice. No gross morphological changes were observed in the transgenic islet and the size and distribution of the islets were similar to control sections. Black boxes correspond to regions magnified on right. [Scale bars: 100 μm (A and B Upper) and 25 μm (B Lower).]

References

    1. Cook D. L., Satin, L. S., Ashford, M. L. & Hales, C. N. (1988) Diabetes 37, 495-498. - PubMed
    1. Misler S. & Giebisch, G. (1992) Curr. Opin. Nephrol. Hypertens. 1, 21-33. - PubMed
    1. Huopio H., Shyng, S. L., Otonkoski, T. & Nichols, C. G. (2002) Am. J. Physiol. 283, E207-E216. - PubMed
    1. Gerich J. E. (1985) Mayo Clin. Proc. 60, 439-443. - PubMed
    1. Miki T., Tashiro, F., Iwanaga, T., Nagashima, K., Yoshitomi, H., Aihara, H., Nitta, Y., Gonoi, T., Inagaki, N., Miyazaki, J. & Seino, S. (1997) Proc. Natl. Acad. Sci. USA 94, 11969-11973. - PMC - PubMed

Publication types

LinkOut - more resources