. 2002 Dec 24;99(26):17197-202.
doi: 10.1073/pnas.212648799. Epub 2002 Dec 16.

Increased level of hemoglobin 1 enhances survival of hypoxic stress and promotes early growth in Arabidopsis thaliana

Affiliations

Increased level of hemoglobin 1 enhances survival of hypoxic stress and promotes early growth in Arabidopsis thaliana

P W Hunt et al. Proc Natl Acad Sci U S A. .

Abstract

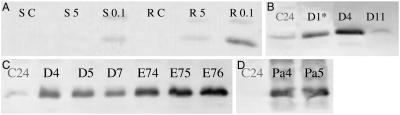
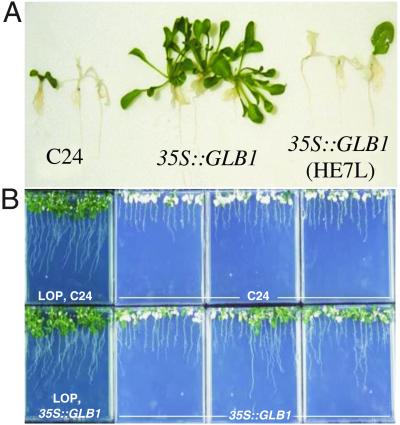
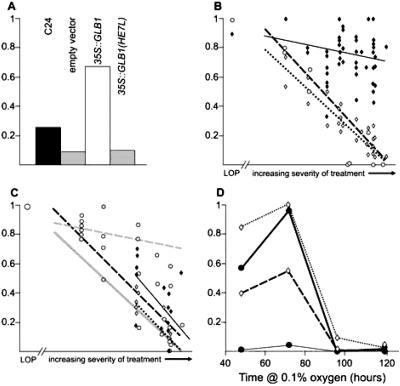
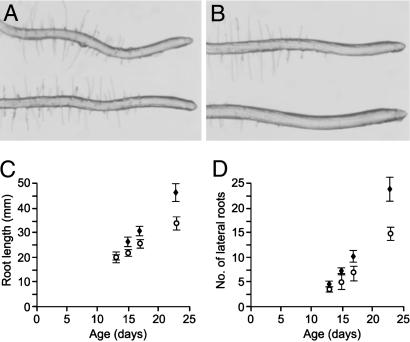
Overexpression of a class 1 Hb (GLB1) protects Arabidopsis thaliana plants from the effects of severe hypoxia. Overexpression of the bifunctional symbiotic Hb (GLB1S) from Parasponia andersonii in A. thaliana also increases survival after hypoxia. Plants overexpressing the Hb 1 protein, mutated to have a low oxygen affinity, are as susceptible to hypoxia as WT plants, suggesting that the protection against hypoxia depends on the ability of the Hb to bind ligands, such as oxygen, with high affinity. A mild hypoxia pretreatment (5%) induces the Hb gene and increases the survival of plants after severe hypoxic treatment (0.1%). These results with Hb 1 show that plant Hbs have a role other than in nitrogen-fixing root nodules. Plants overexpressing the GLB1 protein show early vigorous growth in nonhypoxic conditions and are 50% larger in weight than the controls at 14 days. The constitutive expression of GLB1 also resulted in a reduced number of root hairs and increased number of laterals in the root system.


Figures

Fig 1.
Fig 1.
Western blots showing levels of Hb proteins in transgenic and WT (C24) plants. (A) GLB1 in shoot or root tissues from control plants or plants subjected to 5% or 0.1% oxygen. Lanes contain protein extracted from shoot tissue control (SC), shoot 5% oxygen (S5), shoot 0.1% oxygen (S0.1), root tissue control (RC), root 5% oxygen (L5), and root 0.1% oxygen (R0.1) plants. GLB1 bands migrated at an apparent size of 18 kDa. (B) GLB1 overexpression in the 35S:GLB1 plant lines D1, D4, and D11 compared with WT control (the picture has been split to remove lanes). (C) GLB1 overexpression in the 35S:GLB1 plant lines D4, D5, and D7 and in plant lines overexpressing GLB1(HE7L) (lines E74, E75, and E76) are shown compared with WT. (D) P. andersonii GLB1S levels for 35S:GLB1S(Pa4) and 35S:GLB1S(Pa5) plants and WT controls. High levels of P. andersonii GLB1S were produced in the transgenic plants, but these levels cannot be compared with the levels of A. thaliana GLB1 shown in AC, because these Western blots use different antisera.
Fig 2.
Fig 2.
(A) Plants 17 days after hypoxia. 35S:GLB1(D4) plants survived and grew, whereas most WT and 35S:GLB1(HE7L)(E76) plants died. (B) WT and 35S:GLB1(D4) plants 21 days after hypoxia treatments. Plants were exposed to hypoxia either with no pretreatment or after low oxygen pretreatment (LOP). In the absence of pretreatment, 31% of 35S:GLB1 plants survived and grew, but no WT plants survived in this experiment. All plants of both genotypes survived hypoxia after pretreatment.
Fig 3.
Fig 3.
All four graphs have the proportion of plants surviving after hypoxia indicated by the y axis. 1 indicates that all plants survived and 0 indicates that none survived. (A) Survival of WT (black bar), empty vector controls (gray bar), 35S:GLB1 (empty bar), and 35S:GLB1(HE7L) (striped bar) plants after hypoxia (average of four separate experiments). Overexpression of GLB1, as well as increasing survival of plants after hypoxia, may also have overcome a penalty imposed by the presence of the npt II transgene; compare the transgenic controls to WT. (B and C) Exposure to hypoxia had a variable effect on survival of WT plants in separate experiments. In these graphs the severity of the experiment as indicated by survival of WT plants is plotted on the x axis. A low oxygen pretreatment (LOP) is shown to the left of the broken axis for comparison. The y axis represents posthypoxia survival, so that the line for WT has a slope of 1. Regression lines are plotted in B and C. (B) Response of WT (dotted line, ◊), 35S:GLB1(D4) (black line, ⧫), and GUS reporter controls (dashed line, ○) to increasing severity of hypoxia. (C) Response of 35S:GLB1(D1) (black line, ⧫), 35S:GLB1(D11) (dotted line, ◊), and two 35S:GLB1S lines (dashed line, ○) to increasing severity of hypoxia. The data from the two GLB1S lines were combined because they were not significantly different. (C) The WT and 35S:GLB1(D4) regression lines from B are shown in pale gray for comparison. (D) Survival of plants (y axis) after differing periods of exposure to 0.1% oxygen (x axis) after 5% oxygen pretreatment (dashed lines) or no pretreatment (solid lines). 35S:GLB1(D4) plants (crosses and gray lines) had a higher survival rate than WT plants (ellipses and black lines) in the absence of pretreatment for the first two time points. When pretreatment was provided, both genotypes had high survival rates at 48 and 72 h, but most plants died after 96 h. The small difference at 96 h between 35S:GLB1(D4) and WT plants with pretreatment is statistically significant.
Fig 4.
Fig 4.
Differential interference contrast photomicrographs of root tips from WT (A) and 35S:GLB1(D4) (B) plants. The zones of elongation and root hair differentiation are longer in 35S:GLB1(D4) plants. (C) Root growth in WT (○) and 35S:GLB1 (♦) plants. 35S:GLB1 plants have a greater growth rate than WT controls. (D) Production of lateral roots from WT (○) and 35S:GLB1 (♦) plants. As root development progresses, 35S:GLB1 plants produce significantly more lateral roots. Error bars are standard deviations in C and D.

Similar articles

Cited by

References

    1. Blaxter M. L. (1993) Parasitol. Today 9, 353-360. - PubMed
    1. Doyle J. J. (1998) Trends Plant Sci. 3, 473-478.
    1. Hunt P. W., Watts, R. A., Trevaskis, B., Llewellyn, D. J., Burnell, J., Dennis, E. S. & Peacock, W. J. (2001) Plant Mol. Biol. 47, 677-692. - PubMed
    1. Burr A. H. J., Hunt, P., Wagar, D. R., Dewilde, S., Blaxter, M. L., Vanfleteren, J. R. & Moens, L. (2000) J. Biol. Chem. 275, 4810-4815. - PubMed
    1. Burmester T., Weich, B., Reinhardt, S. & Hankeln, T. (2000) Nature 407, 520-523. - PubMed

MeSH terms

LinkOut - more resources