Comparative Study
. 2002 Dec 17:3:39.
doi: 10.1186/1471-2105-3-39. Epub 2002 Dec 17.

Species-specific protein sequence and fold optimizations

Affiliations
Comparative Study

Species-specific protein sequence and fold optimizations

Michel Dumontier et al. BMC Bioinformatics. .

Abstract

Background: An organism's ability to adapt to its particular environmental niche is of fundamental importance to its survival and proliferation. In the largest study of its kind, we sought to identify and exploit the amino-acid signatures that make species-specific protein adaptation possible across 100 complete genomes.

Results: Environmental niche was determined to be a significant factor in variability from correspondence analysis using the amino acid composition of over 360,000 predicted open reading frames (ORFs) from 17 archaea, 76 bacteria and 7 eukaryote complete genomes. Additionally, we found clusters of phylogenetically unrelated archaea and bacteria that share similar environments by amino acid composition clustering. Composition analyses of conservative, domain-based homology modeling suggested an enrichment of small hydrophobic residues Ala, Gly, Val and charged residues Asp, Glu, His and Arg across all genomes. However, larger aromatic residues Phe, Trp and Tyr are reduced in folds, and these results were not affected by low complexity biases. We derived two simple log-odds scoring functions from ORFs (CG) and folds (CF) for each of the complete genomes. CF achieved an average cross-validation success rate of 85 +/- 8% whereas the CG detected 73 +/- 9% species-specific sequences when competing against all other non-redundant CG. Continuously updated results are available at http://genome.mshri.on.ca.

Conclusion: Our analysis of amino acid compositions from the complete genomes provides stronger evidence for species-specific and environmental residue preferences in genomic sequences as well as in folds. Scoring functions derived from this work will be useful in future protein engineering experiments and possibly in identifying horizontal transfer events.


Figures
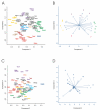
Figure 1
Figure 1
Principal Components Analysis Plots of principal components 1, 2 (A, B) and 3, 4 (C, D) obtained from the amino acid composition of all their predicted open-reading frames as they correspond to the mean composition of the complete genomes (A, C) and their amino acid factor loadings (B, D). GC poor genomes (yellow), GC rich genomes (green), hyperthermophiles (red), thermophiles (orange), thermo-acidophiles (red-brown), solventogens (brown), alkalophiles (blue), extreme halophile (navy), and eukaryotes (purple). Note that there is only one genome representative for any cluster of strains or variants (i.e. Ecoli, EcoliE and EcoliH are all represented by Ecoli). In C, all remaining organisms are clustered around the number 1.
Figure 2
Figure 2
Amino acid composition dendrogram Amino acid composition dendrogram obtained from clustering the average amino acid composition of each genome. Hyperthermophiles (red), thermophiles (orange), (thermo)-acidophiles (brown), solventogens (brown), alkalophiles (blue), extreme halophile (blue) and eukaryotes (purple). The scale represents Euclidian distance.
Figure 3
Figure 3
Comparison of ORF and Fold composition from complete genomes Amino acid composition from predicted open-reading frames (ORF, blue) and fold regions (Fold, red) of Asp (A) and Gln (B) for each complete genome. Bold values indicate significantly large preferences for (positive) or against (negative) certain residues.
Figure 4
Figure 4
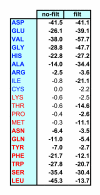
ORF and Fold compositions are significantly different Log of two-tailed paired t-test probabilities between ORF and fold amino acid mean compositions across all genomes, without filtering (no-filt) and with four filtering methods: transmembrane, coiled-coil, low-complexity and compositional bias (filt). Values of less than -2.5 indicate a significant difference.
Figure 5
Figure 5
Species-specific genome and fold composition scoring functions Species-specific genome (CG) and fold (CF) composition scoring functions derived from the amino acid composition of all predicted ORFs or modeled fold regions, respectively, from the complete genomes of E. coli, M. jannaschii and Halobacterium. See text for reference to values in bold.
Figure 6
Figure 6
CG Increased detection when including up to 20 top scoring results The average success rate determined for scoring functions detecting sequences from their parent organism. The average success rate increases as a logarithmic function while increasing the number of top scoring results (blue). The random probability that a scoring function will detect the sequence is a linear function (red). The maximum difference between the observed success and the random probability occurs when 15 or 16 top scores are included for successful detection. Error bars included for average success.
Figure 7
Figure 7
Effect of increasing number of top scores included for detection success with 100 CG scoring functions Detection rate increases for increased the number of included scores. Note that certain scoring functions naturally have a high success rate when just considering the top score (Halo, Ecun, MkanA), but others (EcolE, EcolO, Ecol) are redundant and do not necessarily obtain the top score. The former change little when including the top 5, 10 or 15 scores, but the latter largely benefit from this inclusion.
Figure 8
Figure 8
Sequence to structural domain alignment Sequence to structural domain alignments (A, B). A genomic sequence (SEQ) is aligned to a homologous sequence with a 3D structure (STR) using a secondary structure profile using ClustalW. Note the insertion of gaps (denoted by -, red) in non-structured regions of the 3D structure. In the MERGE step, gaps in the structure are masked out, and eliminated in the compression step (COMP). At this point, the number of identical residues and the number of residues in the genomic sequence occupying a domain position in the structure are counted. Since domain 1 alignment passes the minimal 25% identity and 75% occupancy, it is used for further analysis. However, the %identity in the domain 2 alignment (B) is lower than the threshold of 25%, and the entire domain alignment is masked out and not used in any further analyses.
Figure 9
Figure 9
Table 1.

References

    1. Martin DD, Ciulla RA, Roberts MF. Osmoadaptation in archaea. Appl Environ Microbiol. 1999;65:1815–25. - PMC - PubMed
    1. Gross M, Jaenicke R. Proteins under pressure. The influence of high hydrostatic pressure on structure, function and assembly of proteins and protein complexes. Eur J Biochem. 1994;221:617–30. - PubMed
    1. Vieille C, Zeikus GJ. Hyperthermophilic enzymes: sources, uses, and molecular mechanisms for thermostability. Microbiol Mol Biol Rev. 2001;65:1–43. doi: 10.1128/MMBR.65.1.1-43.2001. - DOI - PMC - PubMed
    1. Audia JP, Webb CC, Foster JW. Breaking through the acid barrier: an orchestrated response to proton stress by enteric bacteria. Int J Med Microbiol. 2001;291:97–106. - PubMed
    1. May BJ, Zhang Q, Li LL, Paustian ML, Whittam TS, Kapur V. Complete genomic sequence of Pasteurella multocida, Pm70. Proc Natl Acad Sci U S A. 2001;98:3460–5. doi: 10.1073/pnas.051634598. - DOI - PMC - PubMed

Publication types

MeSH terms

LinkOut - more resources