

Expression of L-Selectin (CD62L), CD44, and CD25 on activated bovine T cells
- PMID: 12496181
- PMCID: PMC143305
- DOI: 10.1128/IAI.71.1.317-326.2003
Expression of L-Selectin (CD62L), CD44, and CD25 on activated bovine T cells
Abstract
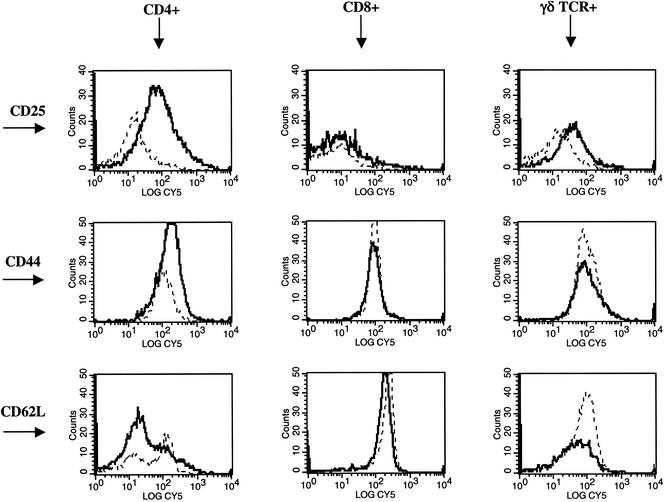
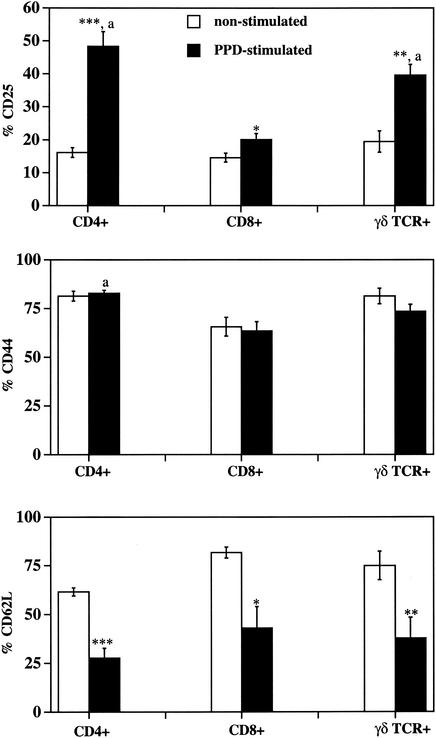
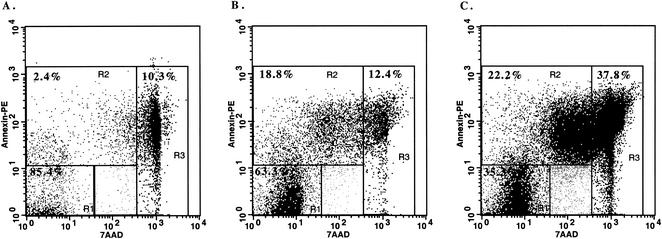
Mycobacterium bovis infection of cattle represents a natural host-pathogen interaction and, in addition to its economic and zoonotic impact, represents a model for human tuberculosis. Extravasation and trafficking of activated lymphocytes to inflammatory sites is modulated by differential expression of multiple surface adhesion molecules. However, effects of M. bovis infection on adhesion molecule expression have not been characterized. To determine these changes, peripheral blood mononuclear cells from M. bovis-infected cattle were stimulated with M. bovis purified protein derivative (PPD) or pokeweed mitogen (PWM) and evaluated concurrently for proliferation and activation marker expression. Stimulation with PPD or PWM increased CD25 and CD44 mean fluorescence intensity (MFI) and decreased CD62L MFI on CD4(+) cells from infected animals. CD62L MFI on PPD- and PWM-stimulated gammadelta T-cell receptor-positive (TCR(+)) and CD8(+) cells was also reduced compared to that of nonstimulated gammadelta TCR(+) and CD8(+) cells. Using a flow cytometry-based proliferation assay, it was determined that proliferating cells, regardless of lymphocyte subset, exhibited increased expression of CD25 and CD44 and decreased expression of CD62L compared to cells that had not proliferated. In contrast to proliferation, activation-induced apoptosis of CD4(+) cells resulted in a significant down regulation of CD44 expression. Lymphocytes obtained from lungs of M. bovis-infected cattle also had reduced expression of CD44 compared to lymphocytes from lungs of noninfected cattle. These alterations in surface molecule expression upon activation likely impact trafficking to sites of inflammation and the functional capacity of these cells within tuberculous granulomas.
Figures


Similar articles
-
Mycobacterium bovis bacille Calmette-Guerin vaccination of cattle: activation of bovine CD4+ and gamma delta TCR+ cells and modulation by 1,25-dihydroxyvitamin D3.Tuberculosis (Edinb). 2003;83(5):287-97. doi: 10.1016/s1472-9792(03)00002-7. Tuberculosis (Edinb). 2003. PMID: 12972342
-
Lymphocyte subset proliferative responses of Mycobacterium bovis-infected cattle to purified protein derivative.Vet Immunol Immunopathol. 2000 Dec 29;77(3-4):257-73. doi: 10.1016/s0165-2427(00)00245-2. Vet Immunol Immunopathol. 2000. PMID: 11137124
-
Specific recognition of mycobacterial protein and peptide antigens by γδ T cell subsets following infection with virulent Mycobacterium bovis.J Immunol. 2014 Mar 15;192(6):2756-69. doi: 10.4049/jimmunol.1302567. Epub 2014 Feb 14. J Immunol. 2014. PMID: 24532582
-
The role of gamma delta T cells in immunity to Mycobacterium bovis infection in cattle.Vet Immunol Immunopathol. 2014 Jun 15;159(3-4):133-43. doi: 10.1016/j.vetimm.2014.02.010. Epub 2014 Feb 24. Vet Immunol Immunopathol. 2014. PMID: 24636303 Review.
-
Bovine tuberculosis: effect of the tuberculin skin test on in vitro interferon gamma responses.Vet Immunol Immunopathol. 2010 Jul;136(1-2):1-11. doi: 10.1016/j.vetimm.2010.02.007. Epub 2010 Feb 13. Vet Immunol Immunopathol. 2010. PMID: 20219253 Review.
Cited by
-
Effect of lipoarabinomannan from Mycobacterium avium subsp avium in Freund's incomplete adjuvant on the immune response of cattle.Braz J Med Biol Res. 2012 Feb;45(2):139-46. doi: 10.1590/s0100-879x2012007500012. Epub 2012 Feb 2. Braz J Med Biol Res. 2012. PMID: 22286534 Free PMC article.
-
Development of an antibody to bovine IL-2 reveals multifunctional CD4 T(EM) cells in cattle naturally infected with bovine tuberculosis.PLoS One. 2011;6(12):e29194. doi: 10.1371/journal.pone.0029194. Epub 2011 Dec 22. PLoS One. 2011. PMID: 22216206 Free PMC article.
-
Mechanisms of T-lymphocyte accumulation during experimental pleural infection induced by Mycobacterium bovis BCG.Infect Immun. 2008 Dec;76(12):5686-93. doi: 10.1128/IAI.00133-08. Epub 2008 Sep 22. Infect Immun. 2008. PMID: 18809659 Free PMC article.
-
Resveratrol ameliorates atherosclerosis induced by high-fat diet and LPS in ApoE-/- mice and inhibits the activation of CD4+ T cells.Nutr Metab (Lond). 2020 May 27;17:41. doi: 10.1186/s12986-020-00461-z. eCollection 2020. Nutr Metab (Lond). 2020. PMID: 32508962 Free PMC article.
-
The Cell-Mediated Immune Response against Bovine alphaherpesvirus 1 (BoHV-1) Infection and Vaccination.Vaccines (Basel). 2023 Apr 2;11(4):785. doi: 10.3390/vaccines11040785. Vaccines (Basel). 2023. PMID: 37112697 Free PMC article. Review.
References
-
- Ahmed, R., and D. Gray. 1996. Immunological memory and protective immunity: understanding their relation. Science 272:54-60. - PubMed
-
- Andersen, P., A. B. Andersen, A. L. Sorensen, and S. Nagai. 1995. Recall of long-lived immunity to Mycobacterium tuberculosis infection in mice. J. Immunol. 154:3359-3372. - PubMed
-
- Ashley, D. M., S. J. Bol, C. Waugh, and G. Kannourakis. 1993. A novel approach to the measurement of different in vitro leukaemic cell growth parameters: the use of PKH GL fluorescent probes. Leuk. Res. 17:873-882. - PubMed
-
- Augustin, A., R. T. Kubo, and G. K. Sim. 1989. Resident pulmonary lymphocytes expressing the γ/δ T-cell receptor. Nature 340:239-241. - PubMed
MeSH terms
Substances
LinkOut - more resources
Full Text Sources
Molecular Biology Databases
Research Materials
Miscellaneous
