

Modeling of transfer kinetics at the serum-cerebrospinal fluid barrier in rabbits with experimental meningitis: application to grepafloxacin
- PMID: 12499181
- PMCID: PMC149016
- DOI: 10.1128/AAC.47.1.138-143.2003
Modeling of transfer kinetics at the serum-cerebrospinal fluid barrier in rabbits with experimental meningitis: application to grepafloxacin
Abstract
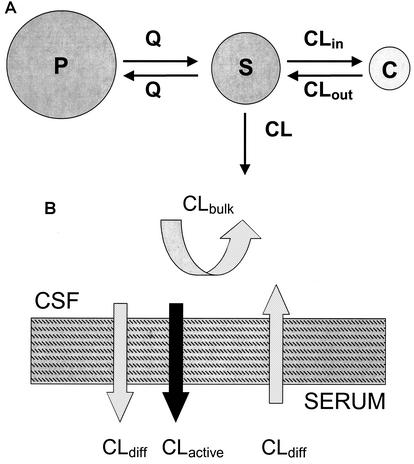
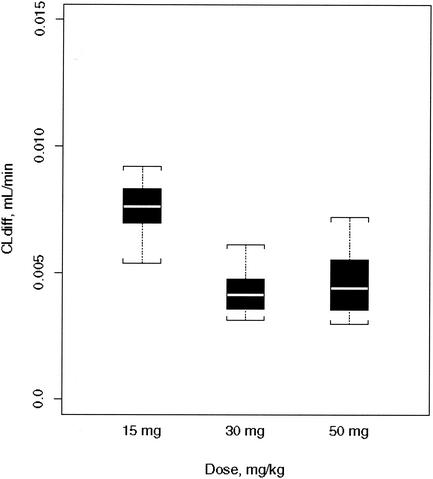
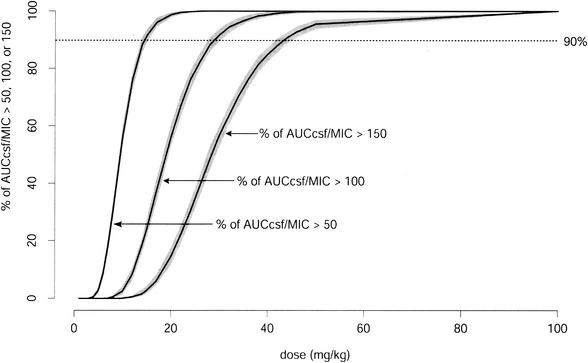
The goals of the present study were to model the population kinetics of in vivo influx and efflux processes of grepafloxacin at the serum-cerebrospinal fluid (CSF) barrier and to propose a simulation-based approach to optimize the design of dose-finding trials in the meningitis rabbit model. Twenty-nine rabbits with pneumococcal meningitis receiving grepafloxacin at 15 mg/kg of body weight (intravenous administration at 0 h), 30 mg/kg (at 0 h), or 50 mg/kg twice (at 0 and 4 h) were studied. A three-compartment population pharmacokinetic model was fit to the data with the program NONMEM (Nonlinear Mixed Effects Modeling). Passive diffusion clearance (CL(diff)) and active efflux clearance (CL(active)) are transfer kinetic modeling parameters. Influx clearance is assumed to be equal to CL(diff), and efflux clearance is the sum of CL(diff), CL(active), and bulk flow clearance (CL(bulk)). The average influx clearance for the population was 0.0055 ml/min (interindividual variability, 17%). Passive diffusion clearance was greater in rabbits receiving grepafloxacin at 15 mg/kg than in those treated with higher doses (0.0088 versus 0.0034 ml/min). Assuming a CL(bulk) of 0.01 ml/min, CL(active) was estimated to be 0.017 ml/min (11%), and clearance by total efflux was estimated to be 0.032 ml/min. The population kinetic model allows not only to quantify in vivo efflux and influx mechanisms at the serum-CSF barrier but also to analyze the effects of different dose regimens on transfer kinetic parameters in the rabbit meningitis model. The modeling-based approach also provides a tool for the simulation and prediction of various outcomes in which researchers might be interested, which is of great potential in designing dose-finding trials.
Figures
Similar articles
-
Grepafloxacin against penicillin-resistant pneumococci in the rabbit meningitis model.J Antimicrob Chemother. 2000 Aug;46(2):249-53. doi: 10.1093/jac/46.2.249. J Antimicrob Chemother. 2000. PMID: 10933648
-
Pharmacokinetics and ocular penetration of grepafloxacin in albino and pigmented rabbits.J Antimicrob Chemother. 2002 Oct;50(4):541-5. doi: 10.1093/jac/dkf178. J Antimicrob Chemother. 2002. PMID: 12356799
-
Pharmacodynamics of gatifloxacin in cerebrospinal fluid in experimental cephalosporin-resistant pneumococcal meningitis.Antimicrob Agents Chemother. 1998 Oct;42(10):2650-5. doi: 10.1128/AAC.42.10.2650. Antimicrob Agents Chemother. 1998. PMID: 9756771 Free PMC article.
-
Pharmacokinetics of grepafloxacin.J Antimicrob Chemother. 1997 Dec;40 Suppl A:35-43. doi: 10.1093/jac/40.suppl_1.35. J Antimicrob Chemother. 1997. PMID: 9484872 Review.
-
Pharmacodynamics of gatifloxacin in experimental models of pneumococcal meningitis.Clin Infect Dis. 2000 Aug;31 Suppl 2:S45-50. doi: 10.1086/314060. Clin Infect Dis. 2000. PMID: 10984328 Review.
Cited by
-
Importance of Peptide transporter 2 on the cerebrospinal fluid efflux kinetics of glycylsarcosine characterized by nonlinear mixed effects modeling.Pharm Res. 2013 May;30(5):1423-34. doi: 10.1007/s11095-013-0980-0. Epub 2013 Feb 1. Pharm Res. 2013. PMID: 23371515 Free PMC article.
-
Pharmacodynamic analysis of the microbiological efficacy of telithromycin in patients with community-acquired pneumonia.Clin Pharmacokinet. 2005;44(3):317-29. doi: 10.2165/00003088-200544030-00007. Clin Pharmacokinet. 2005. PMID: 15762772
-
Activities of ertapenem, a new long-acting carbapenem, against penicillin-sensitive or -resistant pneumococci in experimental meningitis.Antimicrob Agents Chemother. 2003 Jun;47(6):1943-7. doi: 10.1128/AAC.47.6.1943-1947.2003. Antimicrob Agents Chemother. 2003. PMID: 12760871 Free PMC article.
-
Lack of effect of experimental hypovolemia on imipenem muscle distribution in rats assessed by microdialysis.Antimicrob Agents Chemother. 2005 Dec;49(12):4974-9. doi: 10.1128/AAC.49.12.4974-4979.2005. Antimicrob Agents Chemother. 2005. PMID: 16304160 Free PMC article.
-
Application and impact of population pharmacokinetics in the assessment of antiretroviral pharmacotherapy.Clin Pharmacokinet. 2005;44(6):591-625. doi: 10.2165/00003088-200544060-00003. Clin Pharmacokinet. 2005. PMID: 15910009 Review.
References
-
- Barry, A. L., and F. C. Fuchs. 1997. Antibacterial activities of grepafloxacin, ciprofloxacin, ofloxacin and fleroxacin. J. Chemother. 9:9-16. - PubMed
-
- Beal, S., and L. B. Sheiner. 1980. The NONMEM system. Am. Stat. 34:118-119.
-
- Beal, S., and L. B. Sheiner (ed.). 1998. NONMEM users guides. NONMEM Project Group, University of California at San Francisco.
MeSH terms
Substances
LinkOut - more resources
Full Text Sources
