Review
. 2003 Jan;56(1):1-11.
doi: 10.1136/jcp.56.1.1.

Diagnostic role of tests for T cell receptor (TCR) genes

Affiliations
Review

Diagnostic role of tests for T cell receptor (TCR) genes

E Hodges et al. J Clin Pathol. 2003 Jan.

Abstract

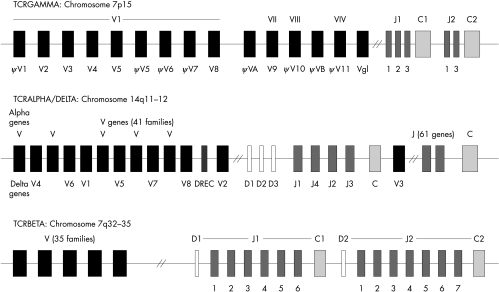
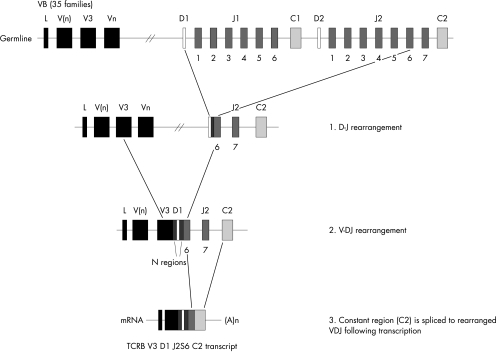
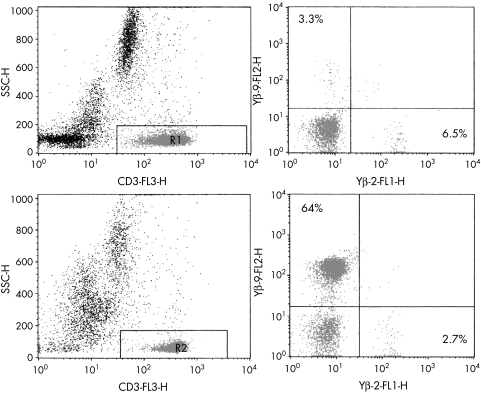
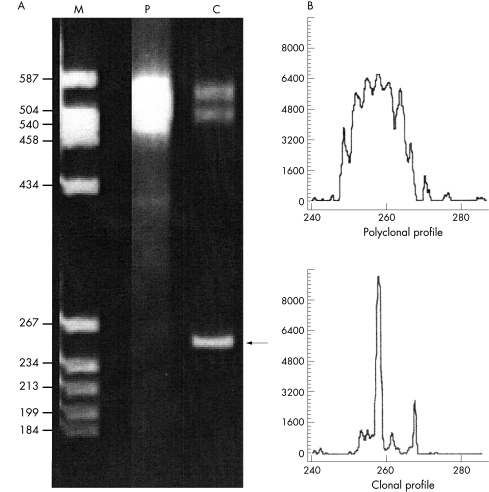
Rapid advances in molecular biological techniques have made it possible to study disease pathogenesis at a genomic level. T cell receptor (TCR) gene rearrangement is an important event in T cell ontogeny that enables T cells to recognise antigens specifically, and any dysregulation in this complex yet highly regulated process may result in disease. Using techniques such as Southern blot hybridisation, polymerase chain reaction, and flow cytometry it has been possible to characterise T cell proliferations in malignancy and in diseases where T cells have been implicated in the pathogenesis. The main aim of this article is to discuss briefly the process of TCR gene rearrangement and highlight the disorders in which expansions or clonal proliferations of T cells have been recognised. It will also describe various methods that are currently used to study T cell populations in body fluids and tissue, their diagnostic role, and current limitations of the methodology.


Figures

Figure 1
Figure 1
Germline organisation of the T cell receptor (TCR) genes. The TCRA, TCRB, and TCRG loci are located on the chromosomes at positions 14q11–12, 7q32–35, and 7p15, respectively. The TCRD loci are also situated on chromosome 14, within the TCRA loci. The gene segments are designated using the World Health Organisation standards for TCR nomenclature. The shaded boxes indicate the type of gene segment: V, variable (black); D, diversity (white); J, joining (dark grey); C, constant (light grey).
Figure 2
Figure 2
T cell receptor β gene (TCRB) rearrangement. The RAG mediated recombination of the TCRB locus is a two step process in which a diversity (D) gene segment first recombines with a joining (J) segment, followed by the recombination of a variable (V) gene to the DJ block. The rearranged VDJ segment is then spliced post transcriptionally to the C transcript.
Figure 3
Figure 3
Representative flow cytometric T cell receptor β variable gene (TCRVB) profiles of a healthy control compared with a patient with T cell lymphoma. TCRVβ repertoire analysis was performed using triple colour analysis with CD3 in combination with two different TCRVβ antibodies for each tube. Images on the left show CD3 versus side scatter (SSC) gating to identify the T cells. Images on the right show staining using Vβ2 and Vβ9 labelled antibodies. Only small percentages of Vβ positive T cells can be identified in the healthy control (upper panel), whereas a large T cell population expressing Vβ9 (64%) was identified in the T cell lymphoma (lower panel).
Figure 4
Figure 4
Heteroduplex and fluorescent gene scanning analyses. The same T cell receptor β gene (TCRB) polymerase chain reaction (PCR) products, amplified using the BIOMED TCR VB–JB primers (JJM van Dongen et al, unpublished data) are shown by (A) heteroduplex analysis and (B) fluorescent gene scanning. (A) M, molecular weight size marker, with sizes indicated in base pairs; P, polyclonal peripheral blood control; C, clonal T cell lymphoma control. In the polyclonal control, only heteroduplexes are visible as a smear at ∼ 500–550 bp, which results from the re-annealing of the polyclonal PCR fragments of different sizes and sequences. The clonal homoduplex PCR product is indicated by an arrow at about ∼ 259 bp, whereas the heteroduplex PCR products in the sample run behind at about 500–550 bp. (B) Relative fluorescent intensities (ordinate) are plotted as a function of PCR fragment size (abscissa). The polyclonal control in the upper panel shows a normal Gaussian distribution of PCR products of different sizes within the appropriate size range (250–290 bp). The clonal T cell lymphoma control in the lower panel shows a dominant fluorescent peak indicative of a clonal population with identical PCR fragment sizes at ∼ 259 bp.

References

    1. Clevers H, Alarcon B, Wileman T, et al. The T cell receptor/CD3 complex: a dynamic protein ensemble. Annu Rev Immunol 1988;6:629–62. - PubMed
    1. Rudd CE, Janssen O, Cai YC, et al. Two-step TCR zeta/CD3-CD4 and CD28 signaling in T cells: SH2/SH3 domains, protein-tyrosine and lipid kinases. Immunol Today 1994;15:225–34. - PubMed
    1. Weiss A, Iwashima M, Irving B, et al. Molecular and genetic insights into T cell antigen receptor signal transduction. Adv Exp Med Biol 1994;365:53–62. - PubMed
    1. Esin S, Shigematsu M, Nagai S, et al. Different percentages of peripheral blood gamma delta + T cells in healthy individuals from different areas of the world. Scand J Immunol 1996;43:593–6. - PubMed
    1. Ciccone E, Ferrini S, Bottino C, et al. A monoclonal antibody specific for a common determinant of the human T cell receptor gamma/delta directly activates CD3+. J Exp Med 1988;168:1–11. - PMC - PubMed

MeSH terms

Substances