. 2002 Dec 26:2:36.
doi: 10.1186/1471-2407-2-36. Epub 2002 Dec 26.

Global and regional estimates of cancer mortality and incidence by site: I. Application of regional cancer survival model to estimate cancer mortality distribution by site

Affiliations

Global and regional estimates of cancer mortality and incidence by site: I. Application of regional cancer survival model to estimate cancer mortality distribution by site

Colin D Mathers et al. BMC Cancer. .

Abstract

Background: The Global Burden of Disease 2000 (GBD 2000) study starts from an analysis of the overall mortality envelope in order to ensure that the cause-specific estimates add to the total all cause mortality by age and sex. For regions where information on the distribution of cancer deaths is not available, a site-specific survival model was developed to estimate the distribution of cancer deaths by site.

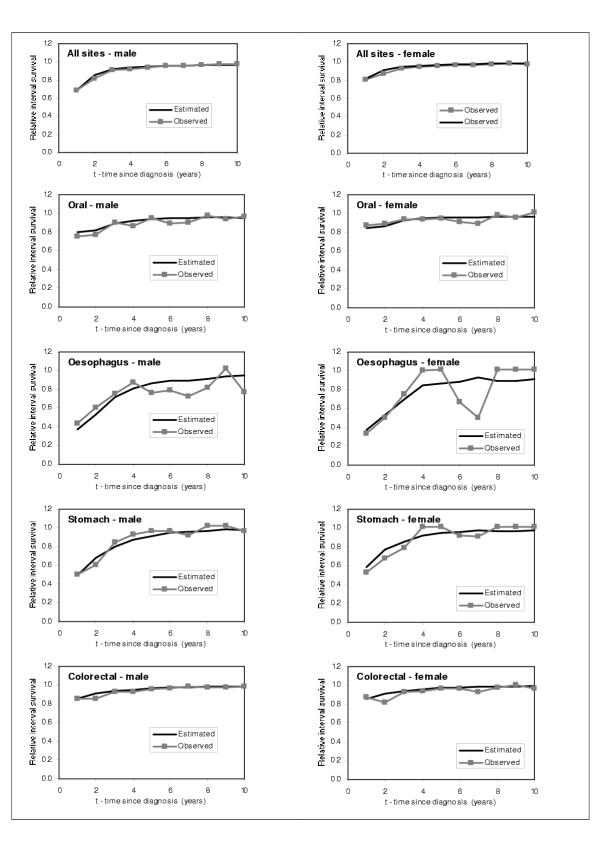
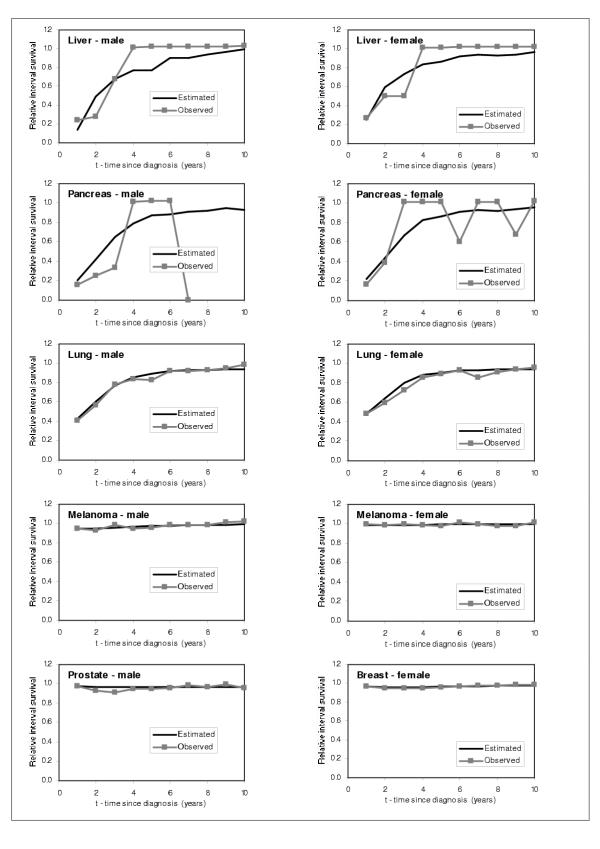
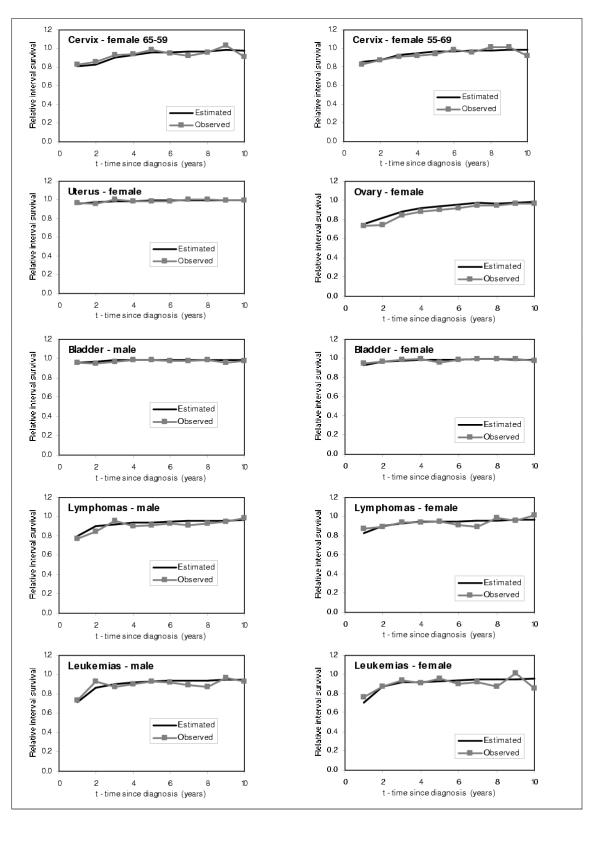
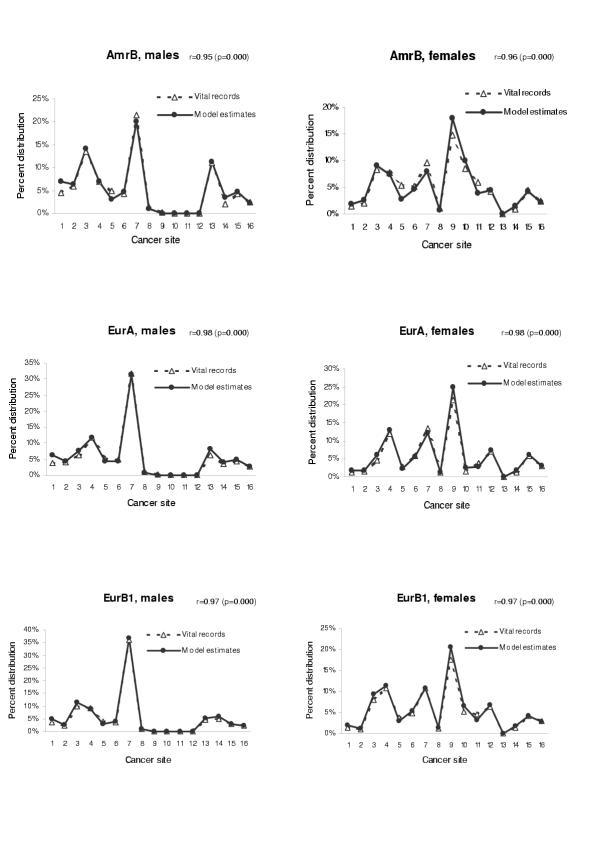
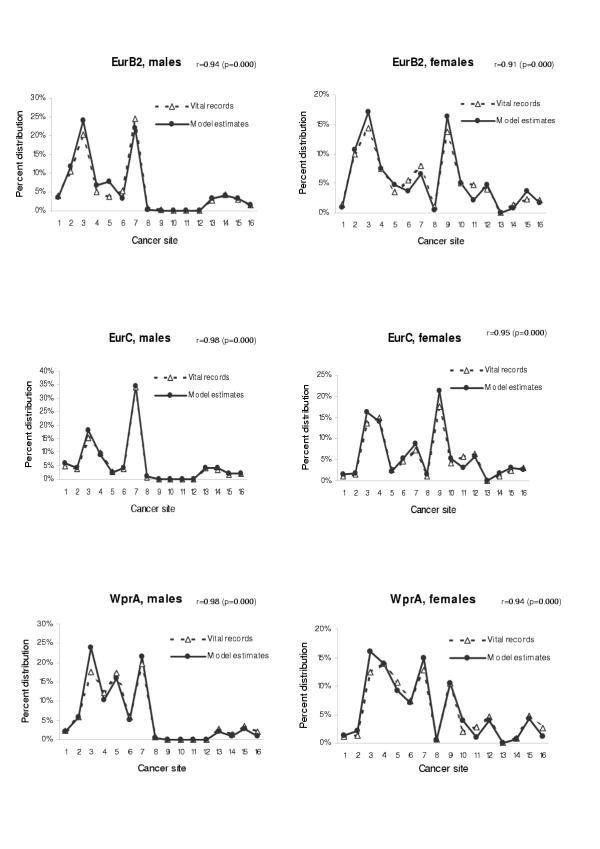
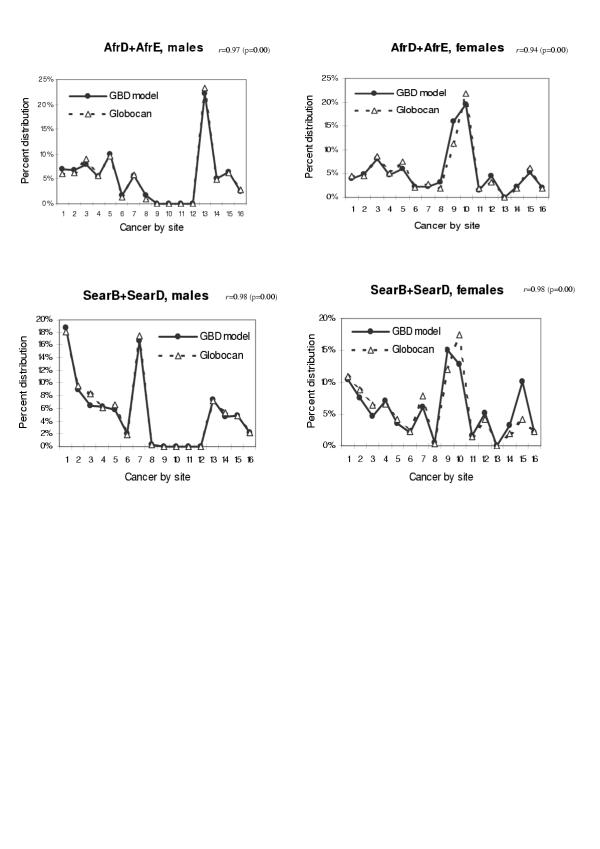
Methods: An age-period-cohort model of cancer survival was developed based on data from the Surveillance, Epidemiology, and End Results (SEER). The model was further adjusted for the level of economic development in each region. Combined with the available incidence data, cancer death distributions were estimated and the model estimates were validated against vital registration data from regions other than the United States.

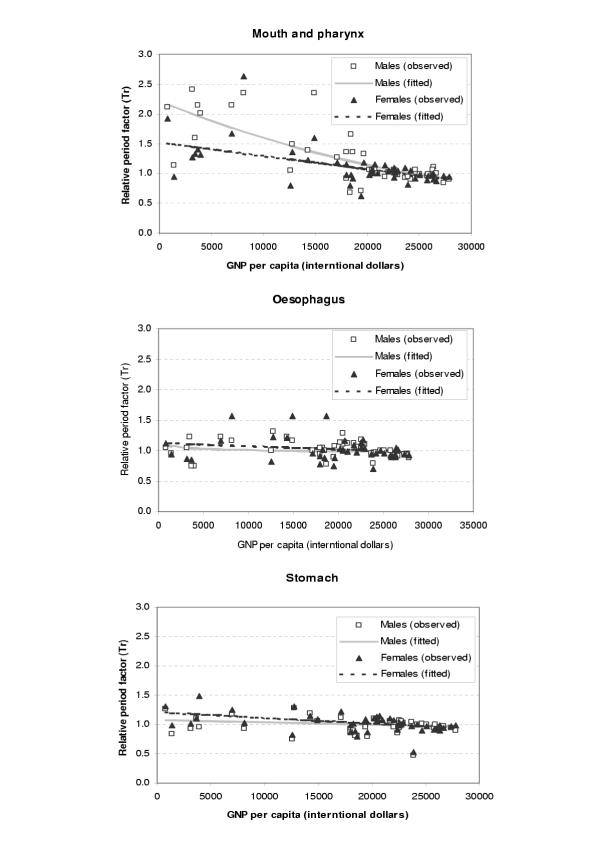
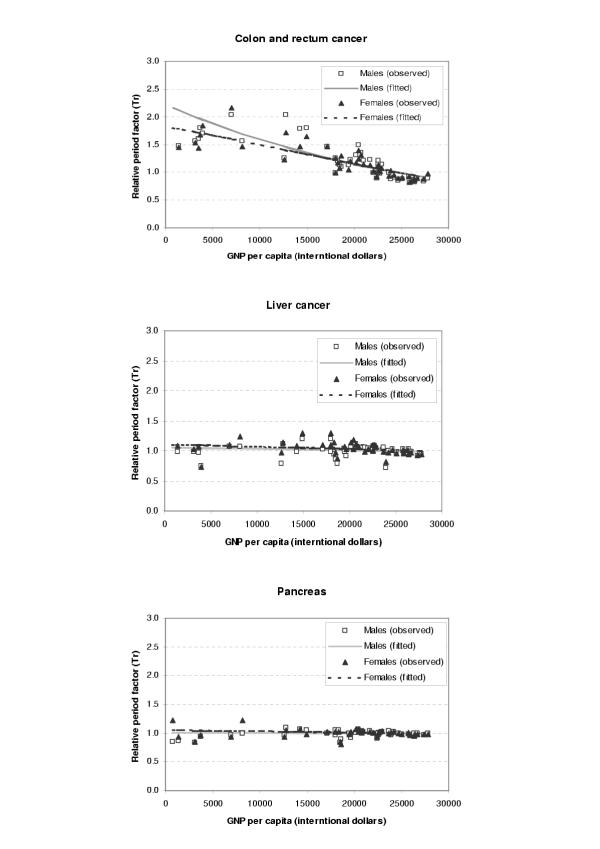
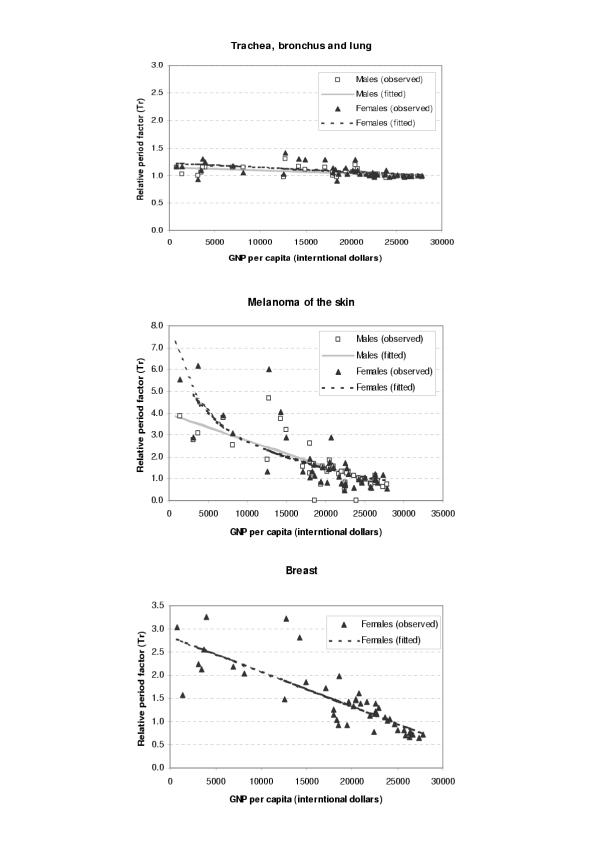
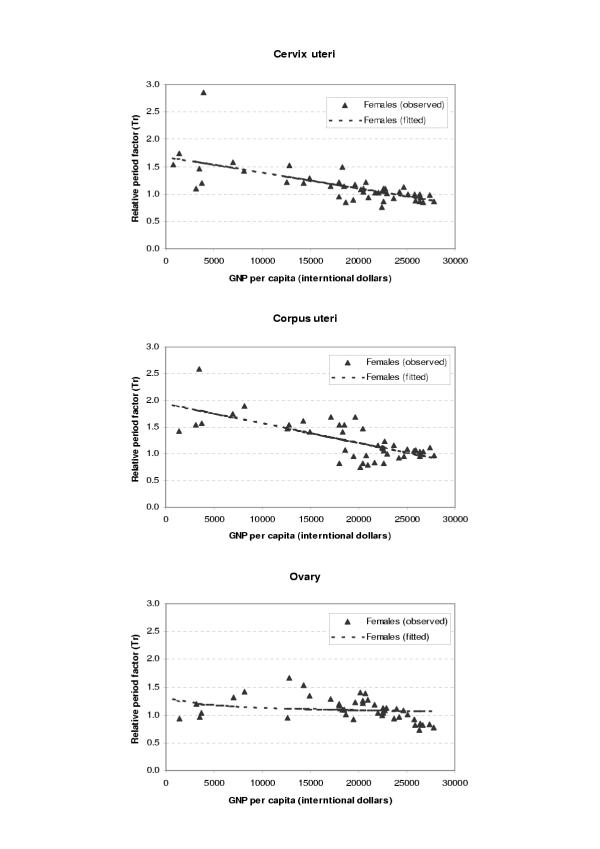
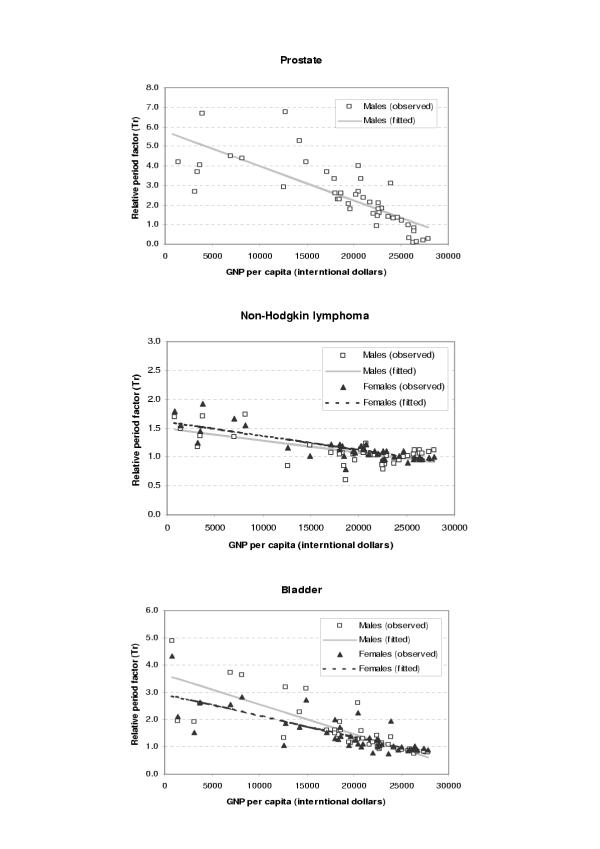
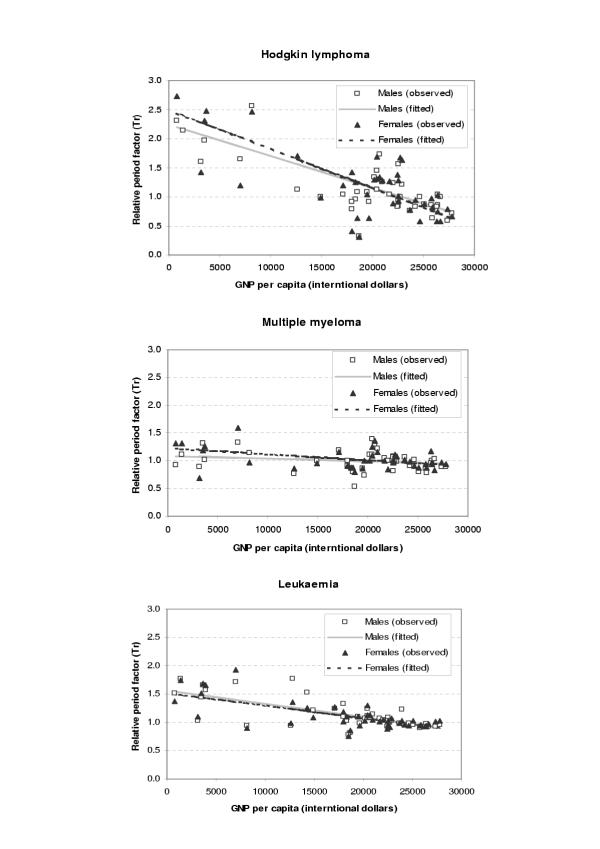
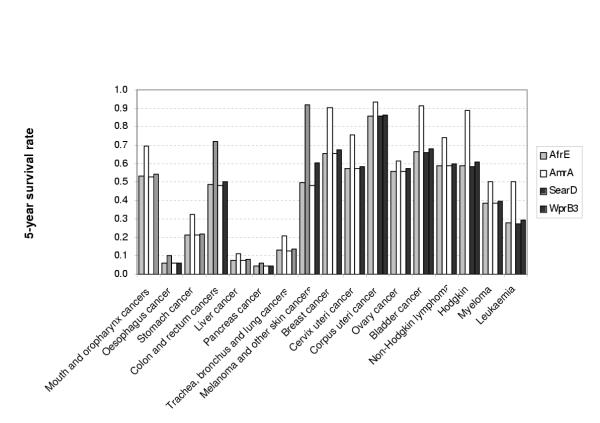
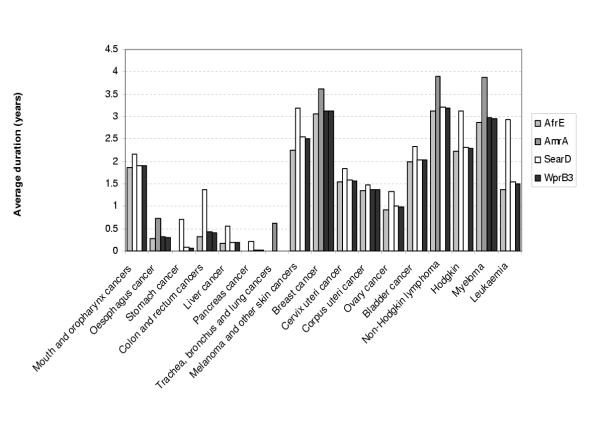
Results: Comparison with cancer mortality distribution from vital registration confirmed the validity of this approach. The model also yielded the cancer mortality distribution which is consistent with the estimates based on regional cancer registries. There was a significant variation in relative interval survival across regions, in particular for cancers of bladder, breast, melanoma of the skin, prostate and haematological malignancies. Moderate variations were observed among cancers of colon, rectum, and uterus. Cancers with very poor prognosis such as liver, lung, and pancreas cancers showed very small variations across the regions.

Conclusions: The survival model presented here offers a new approach to the calculation of the distribution of deaths for areas where mortality data are either scarce or unavailable.


Figures

Figure 1
Figure 1
Observed and fitted period factor by region (Tr) versus GDP per capita (1)
Figure 2
Figure 2
Observed and fitted period factor by region (Tr) versus GDP per capita (2)
Figure 3
Figure 3
Observed and fitted period factor by region (Tr) versus GDP per capita (3)
Figure 4
Figure 4
Observed and fitted period factor by region (Tr) versus GDP per capita (4)
Figure 5
Figure 5
Observed and fitted period factor by region (Tr) versus GDP per capita (5)
Figure 6
Figure 6
Observed and fitted period factor by region (Tr) versus GDP per capita (6)
Figure 7
Figure 7
Comparison between predicted and observed relative interval survival for 55–59 year olds for 15 cancer sites, by sex, 1986 (1)
Figure 8
Figure 8
Comparison between predicted and observed relative interval survival for 55–59 year olds for 15 cancer sites, by sex, 1986 (2)
Figure 9
Figure 9
Comparison between predicted and observed relative interval survival for 55–59 year olds for 15 cancer sites, by sex, 1986 (3)
Figure 10
Figure 10
Mortality distribution by site: comparison between model estimates and vital registration data in three sub regions (AmrB, EurA, and EurB1) Cancer site: 1 = mouth and pharynx, 2 = oesophagus, 3 = stomach, 4 = colon and rectum, 5 = liver, 6 = pancreas, 7 = trachea, bronchus and lung, 8 = melanoma of the skin, 9 = breast, 10 = cervix uteri, 11 = corpus uteri, 12 = ovary, 13 = prostate, 14 = bladder, 15 = lymphomas and multiple myeloma, 16 = leukaemia. r = Pearson's correlation coefficient when analysed with all data in age groups 45–79.
Figure 11
Figure 11
Mortality distribution by site: comparison between model estimates and vital registration data in three sub regions (EurB2, EurC, and WprA) Cancer site: 1 = mouth and pharynx, 2 = oesophagus, 3 = stomach, 4 = colon and rectum, 5 = liver, 6 = pancreas, 7 = trachea, bronchus and lung, 8 = melanoma of the skin, 9 = breast, 10 = cervix uteri, 11 = corpus uteri, 12 = ovary, 13 = prostate, 14 = bladder, 15 = lymphomas and multiple myeloma, 16 = leukaemia. r = Pearson's correlation coefficient when analysed with all data in age groups 45–79.
Figure 12
Figure 12
Mortality distribution by site: comparison between model estimates and previous estimates based on cancer registration data in AFRO and SEARO regions Cancer site: 1 = mouth and pharynx, 2 = oesophagus, 3 = stomach, 4 = colon and rectum, 5 = liver, 6 = pancreas, 7 = trachea, bronchus and lung, 8 = melanoma of the skin, 9 = breast, 10 = cervix uteri, 11 = corpus uteri, 12 = ovary, 13 = prostate, 14 = bladder, 15 = lymphomas and multiple myeloma, 16 = leukaemia. r = Pearson's correlation coefficient when analysed with all data in age groups 45–79.
Figure 13
Figure 13
Five-years survival rate by site in four sub regions, females, age 45–54
Figure 14
Figure 14
Average duration of patients who die from cancer in four sub regions, females, age 45–54

Similar articles

Cited by

References

    1. Murray CJL, Lopez AD, Mathers CD, et al. The Global Burden of Disease 2000 project: aims, methods and data sources. Geneva, World Health Organization. 2001.
    1. Pisani P, Parkin DM, Bray F, et al. Estimates of the worldwide mortality from 25 cancers in 1990. Int J Cancer. 1999;83:18–29. doi: 10.1002/(SICI)1097-0215(19990924)83:1<18::AID-IJC5>3.3.CO;2-D. - DOI - PubMed
    1. Murray CJL, Lopez AD. Mortality by cause for eight regions of the world: global burden of disease study. Lancet. 1997;349:1269–1276. doi: 10.1016/S0140-6736(96)07493-4. - DOI - PubMed
    1. Parkin DM. The global burden of cancer. Semin Cancer Biol. 1998;8:219–235. doi: 10.1006/scbi.1998.0080. - DOI - PubMed
    1. Parkin DM, Pisani P, Ferlay J. Estimates of the worldwide incidence of 25 major cancers in 1990. Int J Cancer. 1999;80:827–841. doi: 10.1002/(SICI)1097-0215(19990315)80:6<827::AID-IJC6>3.0.CO;2-P. - DOI - PubMed

Publication types

LinkOut - more resources