. 2003 Jan 2;22(1):1-12.
doi: 10.1093/emboj/cdg005.

Structural insights into ligand interactions at the acetylcholinesterase peripheral anionic site

Affiliations

Structural insights into ligand interactions at the acetylcholinesterase peripheral anionic site

Yves Bourne et al. EMBO J. .

Abstract

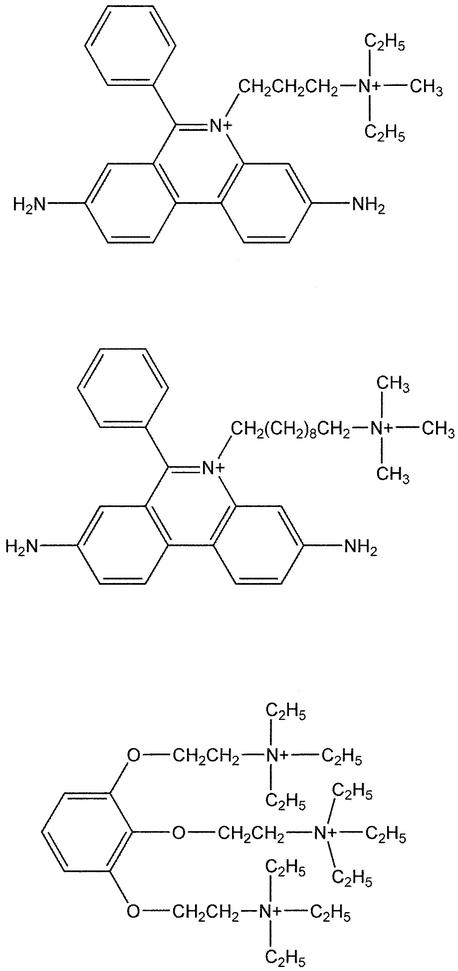
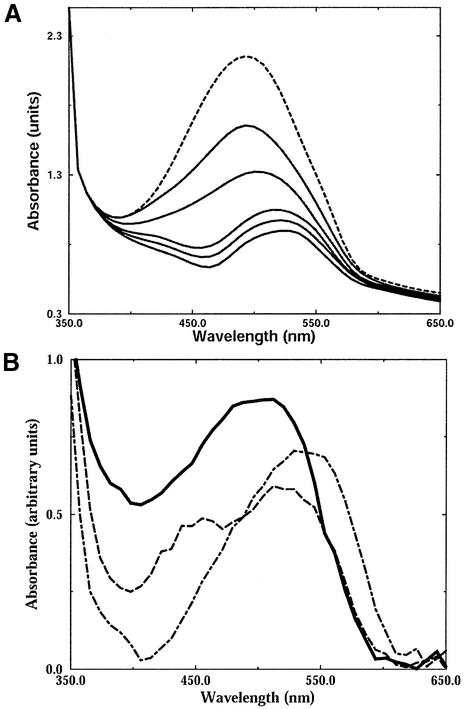
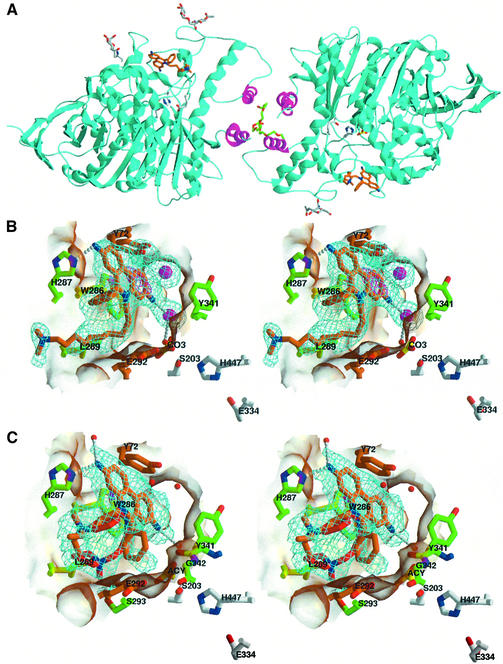
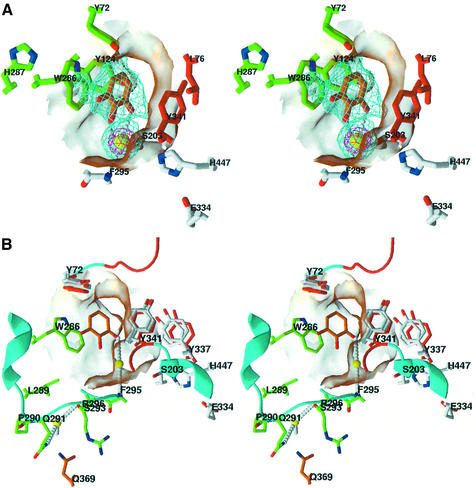
The peripheral anionic site on acetylcholinesterase (AChE), located at the active center gorge entry, encompasses overlapping binding sites for allosteric activators and inhibitors; yet, the molecular mechanisms coupling this site to the active center at the gorge base to modulate catalysis remain unclear. The peripheral site has also been proposed to be involved in heterologous protein associations occurring during synaptogenesis or upon neurodegeneration. A novel crystal form of mouse AChE, combined with spectrophotometric analyses of the crystals, enabled us to solve unique structures of AChE with a free peripheral site, and as three complexes with peripheral site inhibitors: the phenylphenanthridinium ligands, decidium and propidium, and the pyrogallol ligand, gallamine, at 2.20-2.35 A resolution. Comparison with structures of AChE complexes with the peptide fasciculin or with organic bifunctional inhibitors unveils new structural determinants contributing to ligand interactions at the peripheral site, and permits a detailed topographic delineation of this site. Hence, these structures provide templates for designing compounds directed to the enzyme surface that modulate specific surface interactions controlling catalytic activity and non-catalytic heterologous protein associations.


Figures

None
Fig. 1. PAS ligands (AChE inhibitors) used in this study. Schematic drawings (from top to bottom) of the phenylphenanthridinium ligands propidium (PI; 3,8-diamino-5[3′-(diethylmethylammonio) propyl]-6-phenyl phenanthridinium) and decidium (DI; 3,8-diamino-5[10′- (trimethyl-ammonio) decyl]-6-phenyl phenanthridinium), and of the pyrogallol ligand gallamine (GAL; 2,2′,2′′-[1,2,3-benzene-triyltris(oxy)]tris[N,N,N-triethylethanamonium]). PI and DI were diiodide salts and GAL was a triiodide.
None
Fig. 2. Spectrophotometric analysis of the mAChE PAS occupancy by the DI phenanthridinium moiety. (A) Difference spectra between (as the sample) the concentrated DI–mAChE complex solution that yielded the structure reported herein and (as successive references, from top to bottom) increasing DI concentrations in the crystallization buffer; only the spectrum of highest amplitude (dashed line) is recorded against buffer that of lowest amplitude (plain line) corresponds to the highest DI concentration used in the reference. Subtracting the unbound contribution to the spectra unveils the bound component, which is the dominant spectral contributor for the DI–mAChE complex (but not for the PI–mAChE complex where the bound and free components are comparable). (B) Spectrophotometry on crystals of the DI–mAChE complex. Two crystals that respectively yielded the structure reported (solid line) and a structure with low PAS occupancy (dashed line) were analyzed comparatively with a solution of concentrated DI in 70% (w/v) PEG (twice the concentration used for crystallization) in buffer (dotted-dashed line); the differences in the absorbance maxima match the PAS occupancy revealed by the structures.
None
Fig. 3. Structures of the DI–mAChE and PI–mAChE complexes. (A) Ribbon diagram of the mAChE dimer (cyan, with the four-helix bundle in magenta) bound to DI (orange bonds, blue nitrogen and red oxygen atoms). The carbohydrate moieties linked to residues Asn350 and Asn464 in both subunits are displayed as gray bonds and colored spheres. The side chains of the catalytic triad residues, Ser203, Glu334 and His447, are shown as white bonds in the two dimer subunits. The PEG molecule bound at the center of the four-helix bundle and the carbonate molecule bound to Ser203 are shown as green and yellow bonds, respectively. (B) Close-up stereo view of the DI molecule (colored as in A) bound to the PAS, with the 2.35 Å resolution omit Fo – Fc electron density map contoured at 3.5σ (cyan) and 7.5σ (blue); the coordinates of this region were omitted and the protein coordinates were refined by simulated annealing before the phase calculation. The interacting side chains of mAChE residues His287 and Leu289, located in the loop region connecting helices α36,7 and α46,7, and of residues Trp286 and Tyr341 at the gorge entrance, are displayed as green bonds; those of mAChE residues Tyr72 and Glu292, whose respective mutations as methionine and lysine in BgAChE abolish PI binding (see Figure 6), are highlighted in orange. The chloride ions and solvent molecules are shown as pink and red spheres, respectively. The catalytic triad residues, Ser203, Glu334 and His447, and the carbonate molecule (bottom) are shown as white and orange bonds, respectively. Hydrogen bonds between mAChE and the DI molecule are shown as white dotted lines. (C) Close-up stereo view of the PI molecule (colored as for DI) bound to the PAS, with the 2.35 Å resolution omit Fo – Fc electron density map contoured at 3.5σ (cyan). The PI phenyl and diethylmethylammonio moieties, which show alternative positions in the structure, are displayed as red and orange bonds. The mAChE side chains interacting with the PI molecule are displayed as green and orange bonds as in (B). The mAChE molecular surfaces buried at the DI–mAChE (B) and PI–mAChE (C) complex interfaces are displayed in transparency. mAChE numbering and secondary-structure elements are specified according to Rachinsky et al. (1990) and Cygler et al. (1993), respectively.
None
Fig. 4. Structure of the GAL–mAChE complex. (A) Close-up stereo view of the GAL molecule (colored as for DI and PI; see Figure 3) bound to the PAS, with the 2.2 Å resolution omit Fo – Fc electron density map contoured at 3.5σ (cyan) and 15σ (pink). The mAChE backbone regions Asp74–Pro78 and Val340–Gly342 that are disordered at the gorge entrance are highlighted in red; the side chains of PAS residues Leu76 and Tyr341, also disordered in the density maps, are shown as red bonds. The iodide ion is shown as a yellow sphere. (B) Stereo view of the PAS region in the GAL–mAChE complex, showing the two iodide ions (yellow spheres) bound in the region of the gorge entrance. The backbone regions and the side chains of Tyr72, Tyr337 and Tyr341, which move significantly in the GAL–mAChE complex compared with their positions in any of the other three structures, are shown in red. The side chains of the same tyrosine residues as seen in each of the three other structures (apo-mAChE and DI– and PI–mAChE complexes) are superimposed and displayed as white bonds with red hydroxyls. The mAChE molecular surface buried at the GAL–mAChE complex interface is shown in transparency.
None
Fig. 5. Structural comparisons of the DI–mAChE complex with the Fas2–mAChE complex and the crystalline mAChE tetramer. (A) Close-up view of a superimposition of the DI molecule (orange bonds, blue nitrogen and red oxygen atoms) in the DI–mAChE complex with the interacting central loop (loop II) of Fas2 (yellow) bound to mAChE in the Fas2–mAChE complex (1KU6), according to all Cα atoms of mAChE in the two structures. The Fas2 side chains that match the structural determinants of the DI molecule are displayed as green bonds. (B) Superimposition of the DI molecule (colored as in A) in the DI–mAChE complex with the PAS-occluding short Ω loop (yellow) of subunit A in the mAChE tetrameric assembly (1MAA), according to all Cα atoms of mAChE in the DI–mAChE complex and in the tetramer subunit C. Those of the mAChE short Ω loop side chains that match the structural determinants of the DI molecule are displayed as orange bonds. The mAChE molecular surfaces buried at the Fas2–mAChE complex interface (A) and at the Ω loop–PAS interface (B) are shown in transparency.
None
Fig. 6. mAChE residues in the PAS, as defined from the mAChE–PAS ligand complex structures. Alignment of the mAChE sequence segments and residues that define the PAS topography with the corresponding sequences in HuAChE, EeAChE, TcAChE, BgAChE and human butyrylcholinesterase (HuBChE). The mAChE numbering and secondary structure motifs are displayed below the alignment. Triangles above the mAChE sequence indicate the residues that bury 10% or more of their side chain surface area at the interfaces of the DI–mAChE (black triangles, tip down) and PI–mAChE complexes (black and open triangles, tip up: first and second conformation, respectively). Open circles below the alignment indicate the residues that bury 10% or more of their side chain surface area at the interface of the GAL–mAChE complex; black bars indicate the two mAChE surface loops that are disordered in the GAL–mAChE complex; orange and green circles indicate the residues involved in the two iodide- binding sites, located at the gorge entrance and within the gorge, respectively, in this complex. Black circles below the alignment indicate the mAChE residues whose side chains are buried at the Fas2–mAChE complex interface. BgAChE residues Met70 and Lys285, whose substitution by TcAChE residues tyrosine and aspartic acid restores sensitivity to PI, are highlighted in blue.

Similar articles

Cited by

References

    1. Barak D., Kronman,C., Ordentlich,A., Ariel,N., Bromberg,A., Marcus,D., Lazar,A., Velan,B. and Shafferman,A. (1994) Acetyl cholinesterase peripheral anionic site degeneracy conferred by amino acid arrays sharing a common core. J. Biol. Chem., 269, 6296–6305. - PubMed
    1. Barak D., Ordentlich,A., Bromberg,A., Kronman,C., Marcus,D., Lazar,A., Ariel,N., Velan,B. and Shafferman,A. (1995) Allosteric modulation of acetylcholinesterase activity by peripheral ligands involves a conformational transition of the anionic subsite. Biochemistry, 34, 15444–15452. - PubMed
    1. Bartolucci C., Perola,E., Cellai,L., Brufani,M. and Lamba,D. (1999) ‘Back door’ opening implied by the crystal structure of a carbamoylated acetylcholinesterase. Biochemistry, 38, 5714–5719. - PubMed
    1. Berman H.A. and Decker,M.M. (1986) Kinetic, equilibrium and spectroscopic studies on cation association at the active center of acetylcholinesterase: topographic distinction between trimethyl and trimethylammonium sites. Biochim. Biophys. Acta, 872, 125–133. - PubMed
    1. Berman H.A., Yguerabide,J. and Taylor,P. (1980) Fluorescence energy transfer on acetylcholinesterase: spatial relationship between peripheral site and active center. Biochemistry, 19, 2226–2235. - PubMed

Publication types