

Experimental glomerulopathy alters renal cortical cholesterol, SR-B1, ABCA1, and HMG CoA reductase expression
- PMID: 12507911
- PMCID: PMC1851117
- DOI: 10.1016/S0002-9440(10)63819-9
Experimental glomerulopathy alters renal cortical cholesterol, SR-B1, ABCA1, and HMG CoA reductase expression
Abstract
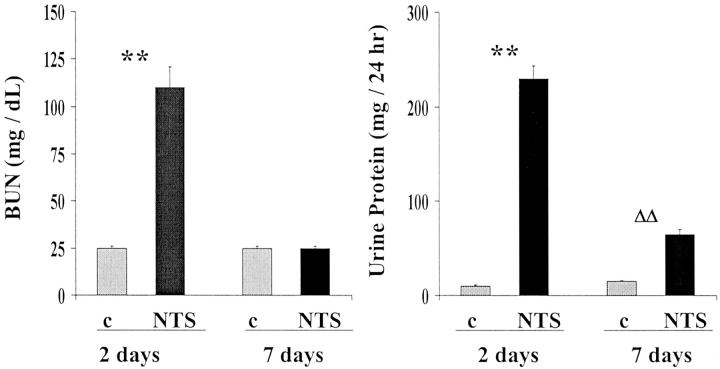
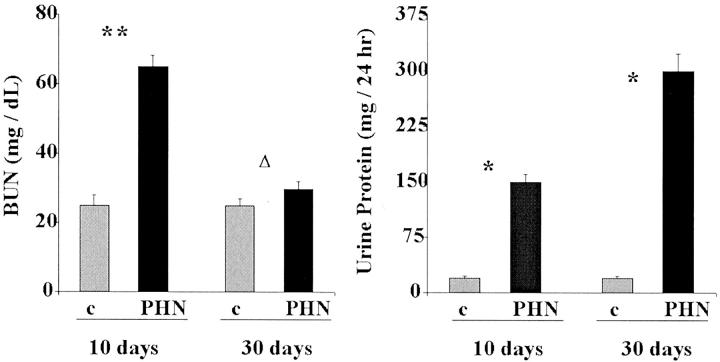
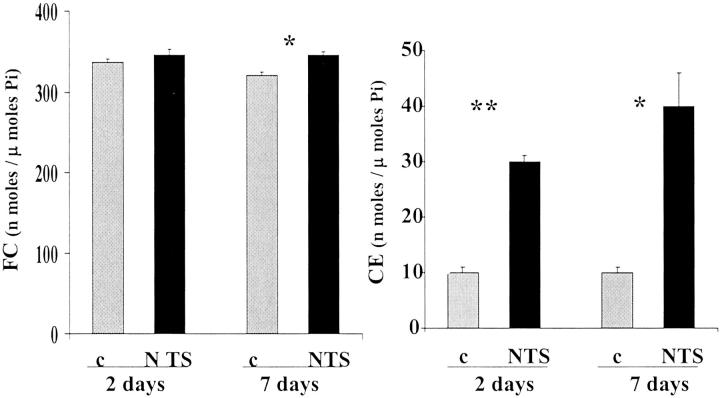
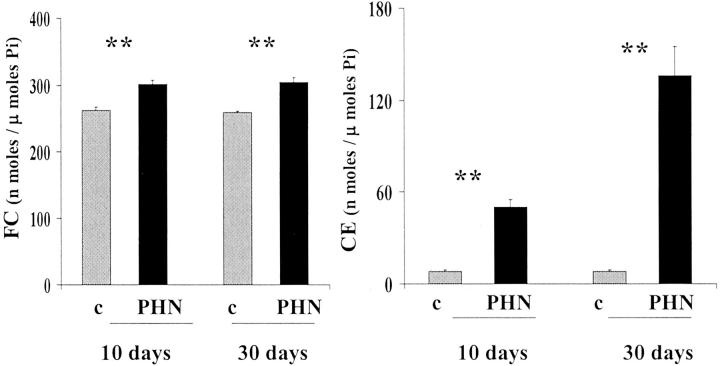
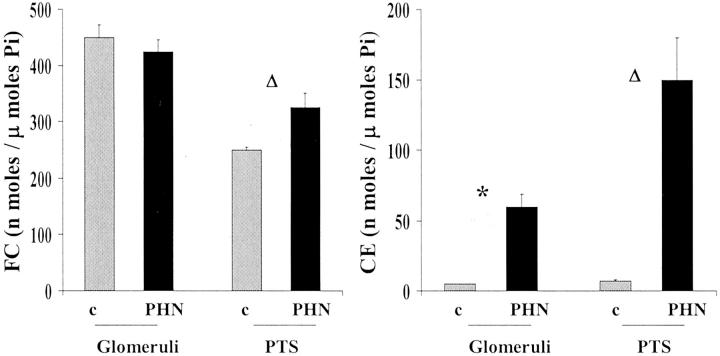
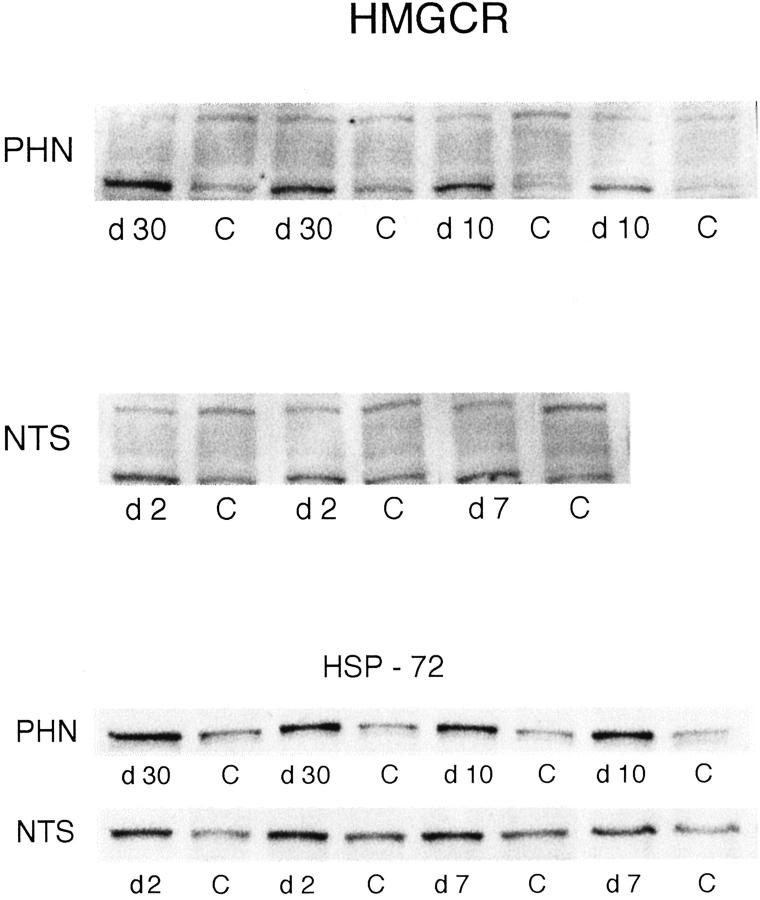
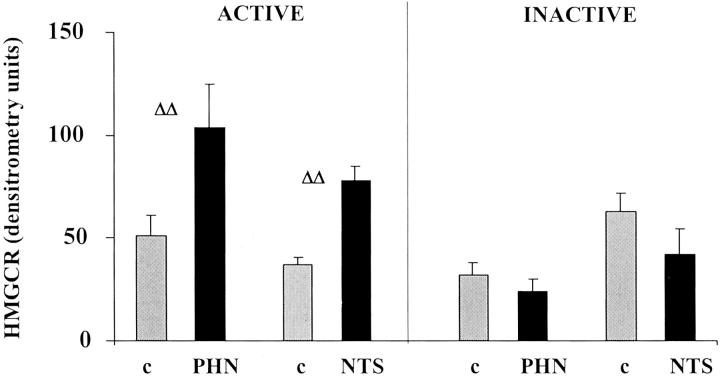
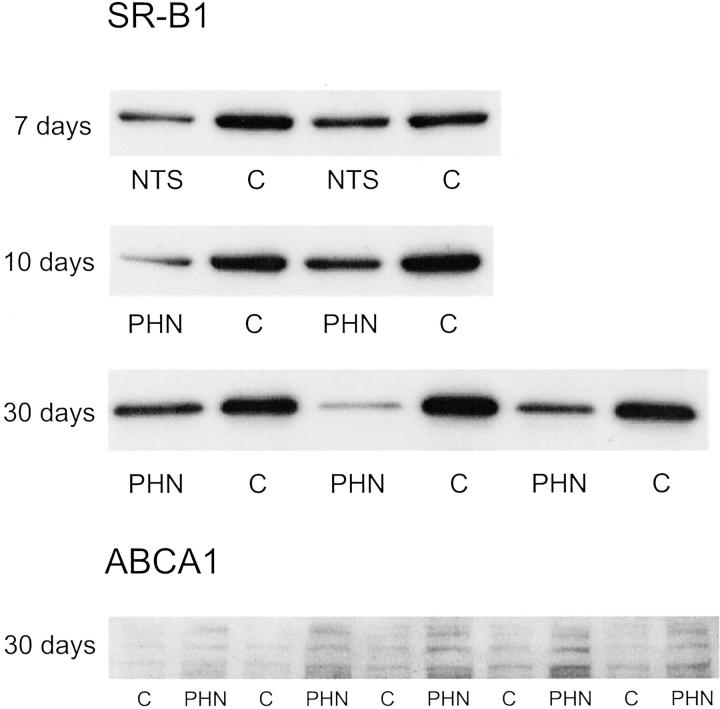
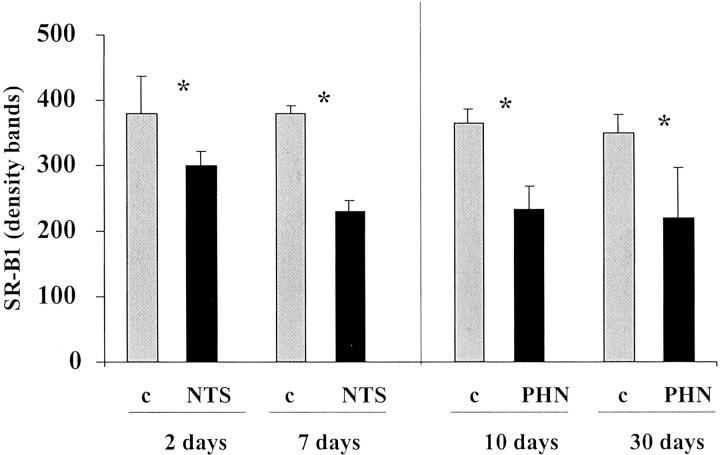
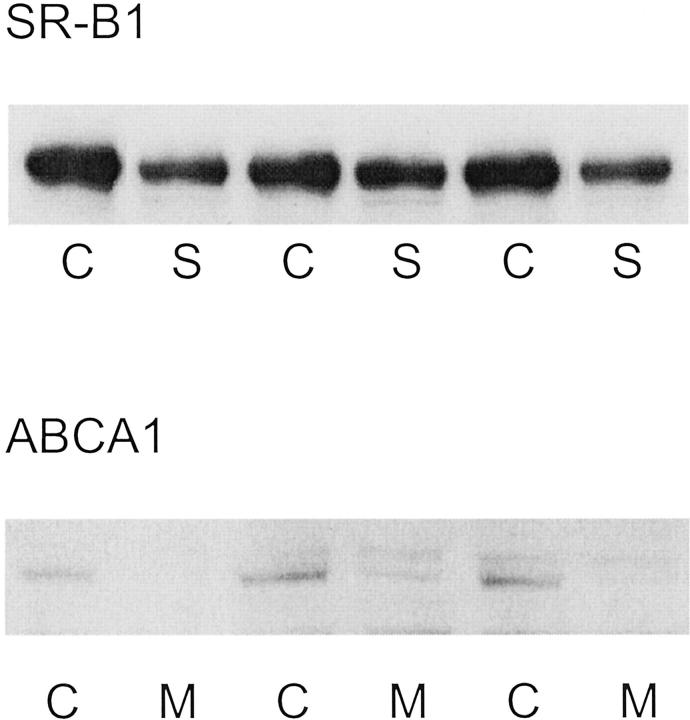
Previous studies indicate that acute tubular injury causes free cholesterol (FC) and cholesteryl ester (CE) accumulation within renal cortex/proximal tubules. This study assessed whether similar changes occur with glomerulopathy/nephrotic syndrome, in which high-circulating/filtered lipoprotein levels increase renal cholesterol supply. Potential adaptive changes in cholesterol synthetic/transport proteins were also assessed. Nephrotoxic serum (NTS) or passive Heymann nephritis (PHN) was induced in Sprague-Dawley rats. Renal injury (blood urea nitrogen, proteinuria) was assessed 2 and 7 days (NTS), or 10 and 30 days (PHN) later. FC and CE levels in renal cortex, isolated glomeruli, and proximal tubule segments were determined. SR-B1 (a CE influx protein), ABCA1 (a FC exporter), and HMG CoA reductase protein/mRNA levels were also assessed. FC was minimally elevated in renal cortex (0 to 15%), the majority apparently localizing to proximal tubules. More dramatic CE elevations were found ( approximately 5 to 15x), correlating with the severity of proteinuria at any single time point (r >/= 0.85). Cholesterol increments were associated with decreased SR-B1, increased ABCA1, and increased HMG CoA reductase (HMGCR) protein and its mRNA. Tubule (HK-2) cell culture data indicated that SR-B1 and ABCA1 levels are responsive to cholesterol supply. Experimental nephropathy can increase renal FC, and particularly CE, levels, most notably in proximal tubules. These changes are associated with adaptations in SR-B1 and ABCA1 expression, which are physiologically appropriate changes for a cholesterol overload state. However, HMGCR protein/mRNA increments can also result. These seem to reflect a maladaptive response, potentially contributing to a cell cholesterol overload state.
Figures
Similar articles
-
Acute tubular injury causes dysregulation of cellular cholesterol transport proteins.Am J Pathol. 2003 Jul;163(1):313-20. doi: 10.1016/S0002-9440(10)63655-3. Am J Pathol. 2003. PMID: 12819036 Free PMC article.
-
Sepsis syndrome stimulates proximal tubule cholesterol synthesis and suppresses the SR-B1 cholesterol transporter.Kidney Int. 2003 Jan;63(1):123-33. doi: 10.1046/j.1523-1755.2003.00735.x. Kidney Int. 2003. PMID: 12472775
-
Proximal tubular cholesterol loading after mitochondrial, but not glycolytic, blockade.Am J Physiol Renal Physiol. 2003 Dec;285(6):F1092-9. doi: 10.1152/ajprenal.00187.2003. Epub 2003 Sep 2. Am J Physiol Renal Physiol. 2003. PMID: 12952856
-
Foam cells in atherosclerosis.Clin Chim Acta. 2013 Sep 23;424:245-52. doi: 10.1016/j.cca.2013.06.006. Epub 2013 Jun 16. Clin Chim Acta. 2013. PMID: 23782937 Review.
-
Scavenger receptor BI and ATP-binding cassette transporter A1 in reverse cholesterol transport and atherosclerosis.Curr Opin Lipidol. 2005 Jun;16(3):307-15. doi: 10.1097/01.mol.0000169351.28019.04. Curr Opin Lipidol. 2005. PMID: 15891392 Review.
Cited by
-
Paternal High Fat Diet in Rats Leads to Renal Accumulation of Lipid and Tubular Changes in Adult Offspring.Nutrients. 2016 Aug 23;8(9):521. doi: 10.3390/nu8090521. Nutrients. 2016. PMID: 27563922 Free PMC article.
-
Metabolism, energetics, and lipid biology in the podocyte - cellular cholesterol-mediated glomerular injury.Front Endocrinol (Lausanne). 2014 Oct 14;5:169. doi: 10.3389/fendo.2014.00169. eCollection 2014. Front Endocrinol (Lausanne). 2014. PMID: 25352833 Free PMC article. Review.
-
High-calorie diet partially ameliorates dysregulation of intrarenal lipid metabolism in remnant kidney.J Nutr Biochem. 2010 Oct;21(10):999-1007. doi: 10.1016/j.jnutbio.2009.08.006. Epub 2009 Dec 1. J Nutr Biochem. 2010. PMID: 19954950 Free PMC article.
-
Acute tubular injury causes dysregulation of cellular cholesterol transport proteins.Am J Pathol. 2003 Jul;163(1):313-20. doi: 10.1016/S0002-9440(10)63655-3. Am J Pathol. 2003. PMID: 12819036 Free PMC article.
-
Network Pharmacology and Molecular Docking Validation to Explore the Pharmacological Mechanism of Zhuling Decoction against Nephrotic Syndrome.Curr Pharm Des. 2024;30(28):2244-2256. doi: 10.2174/0113816128305808240529115047. Curr Pharm Des. 2024. PMID: 38910482
References
-
- Zager RA, Burkhart KM, Johnson A, Sacks B: Increased proximal tubular cholesterol content: implications for cell injury and the emergence of “acquired cytoresistance.” Kidney Int 1999, 56:1788-1797 - PubMed
-
- Zager RA, Johnson A, Anderson K, Wright S: Cholesterol ester accumulation: an immediate consequence of acute ischemic renal injury. Kidney Int 2001, 59:1750-1761 - PubMed
-
- Zager RA, Johnson AC: Renal cortical cholesterol accumulation: an integral component of the systemic stress response. Kidney Int 2001, 60:2229-2310 - PubMed
Publication types
MeSH terms
Substances
Grants and funding
LinkOut - more resources
Full Text Sources
Medical
Research Materials
