. 2003 Jan;121(1):3-16.
doi: 10.1085/jgp.20028671.

Dihydropyridine receptors as voltage sensors for a depolarization-evoked, IP3R-mediated, slow calcium signal in skeletal muscle cells

Affiliations

Dihydropyridine receptors as voltage sensors for a depolarization-evoked, IP3R-mediated, slow calcium signal in skeletal muscle cells

Roberto Araya et al. J Gen Physiol. 2003 Jan.

Abstract

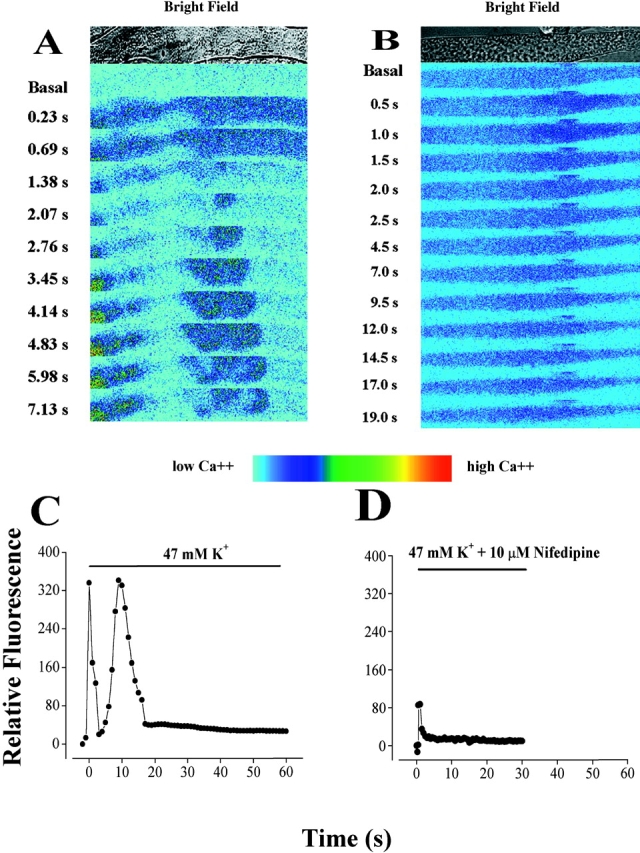
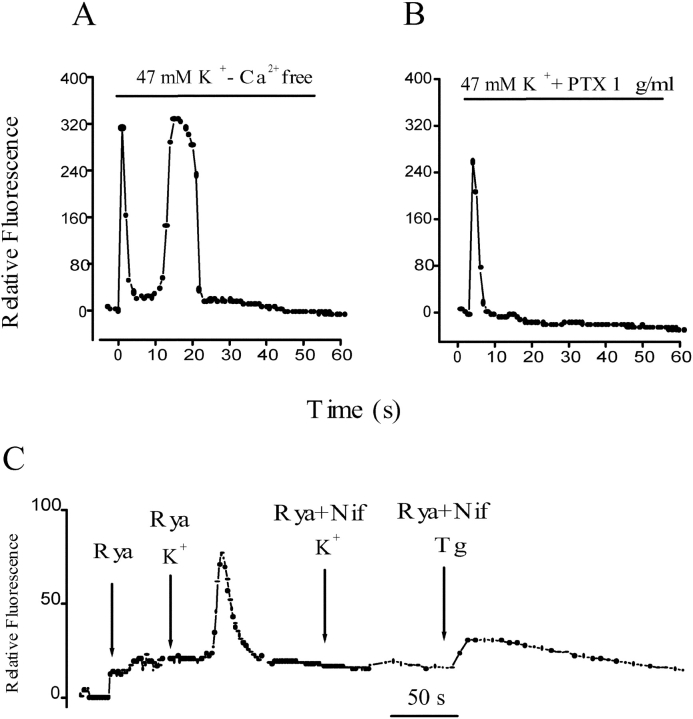
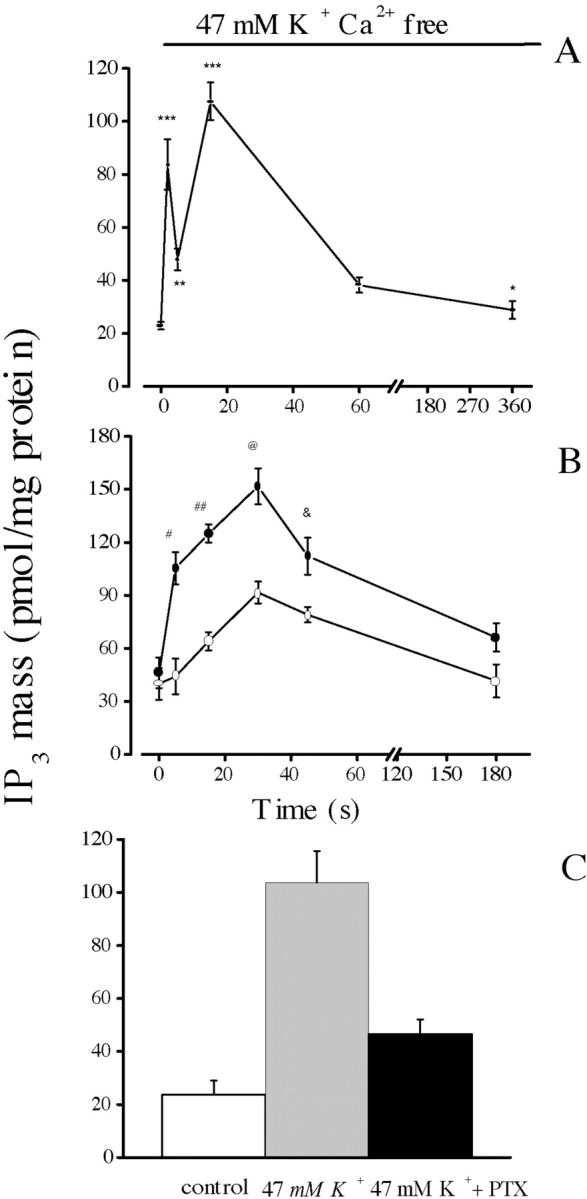
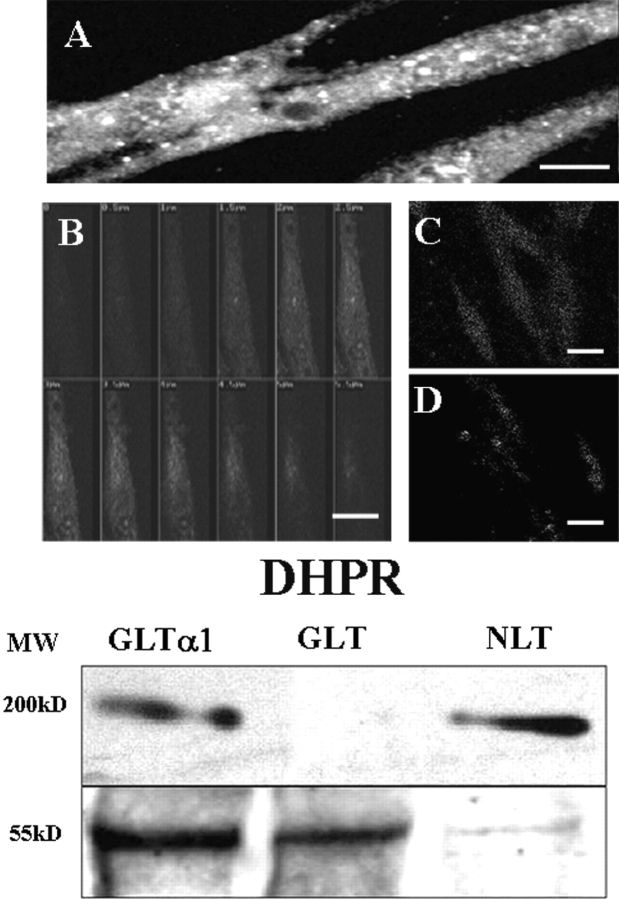
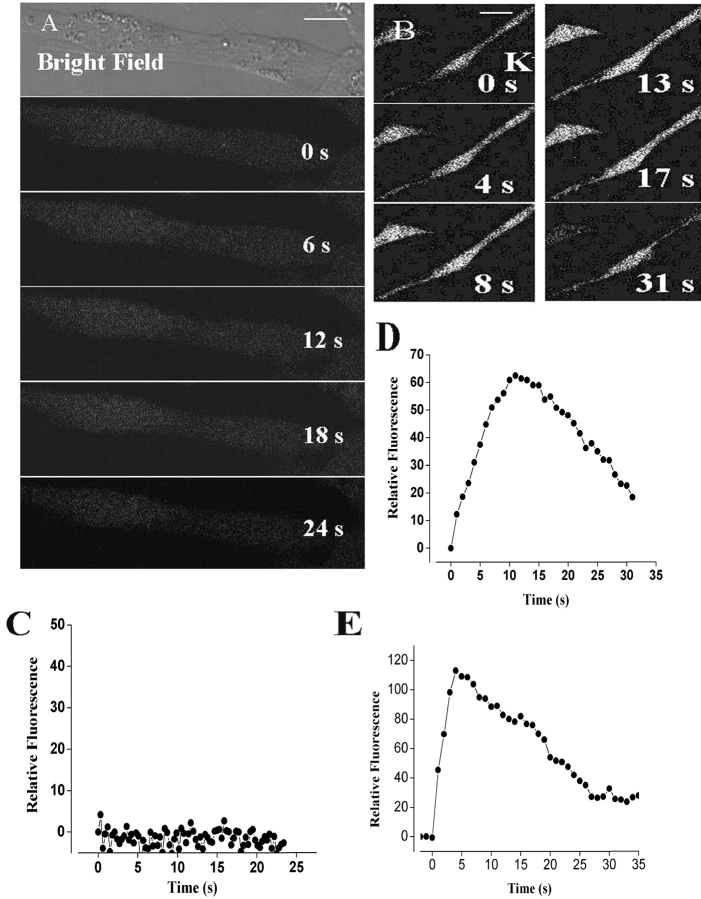
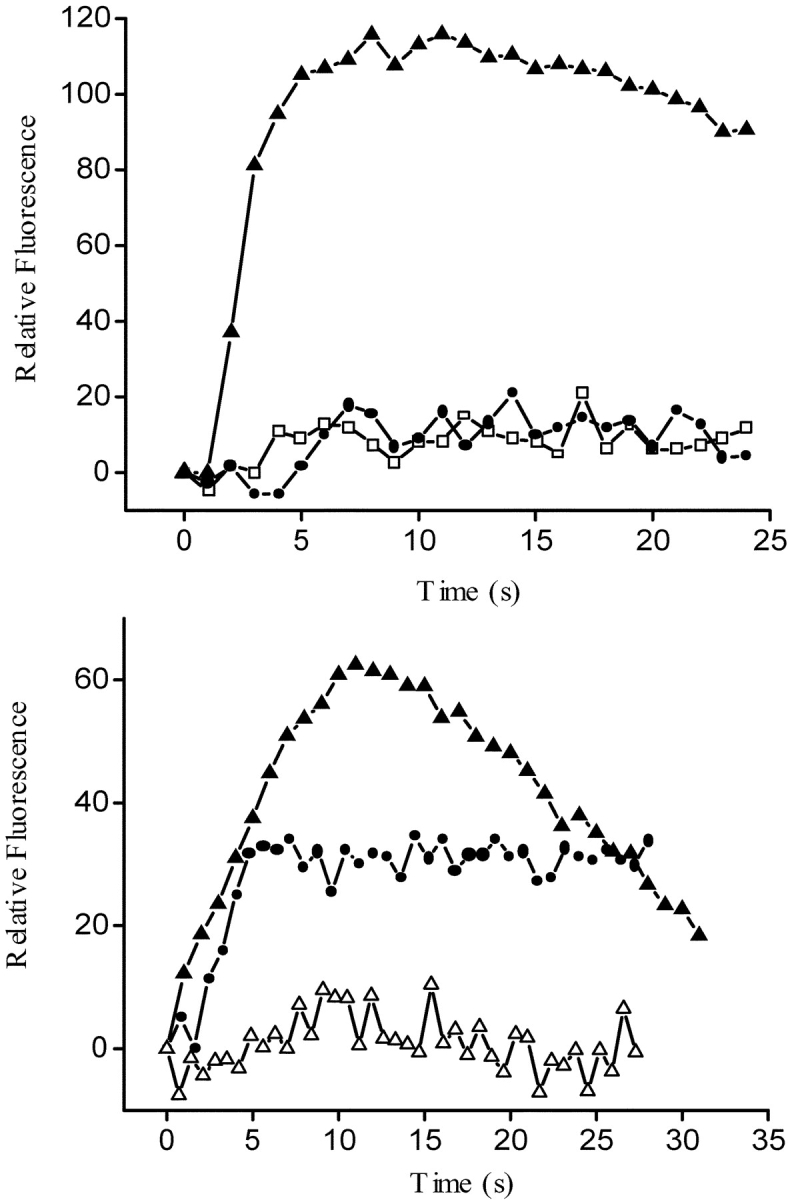
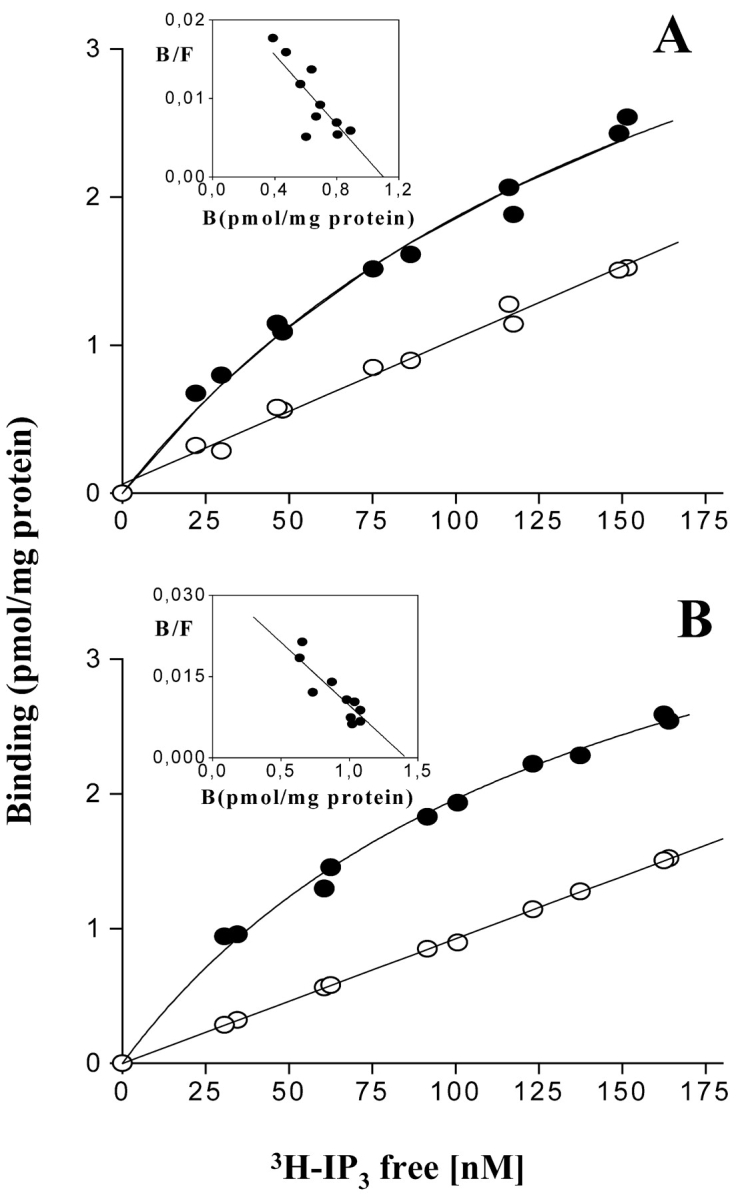
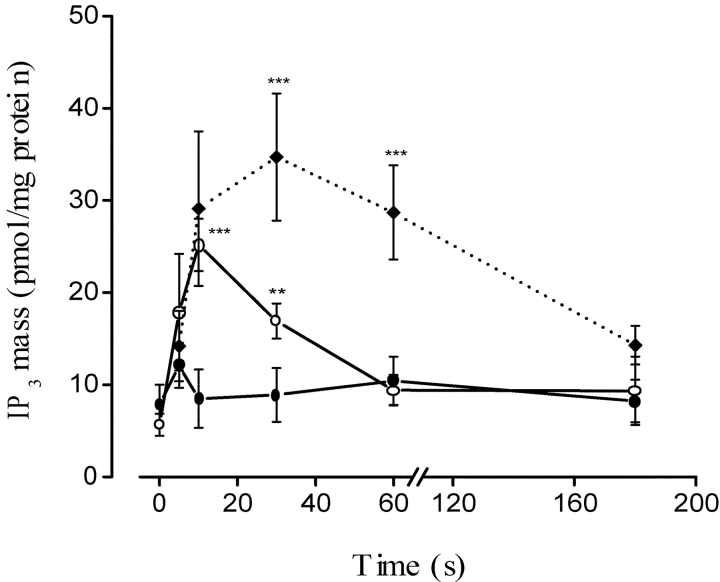
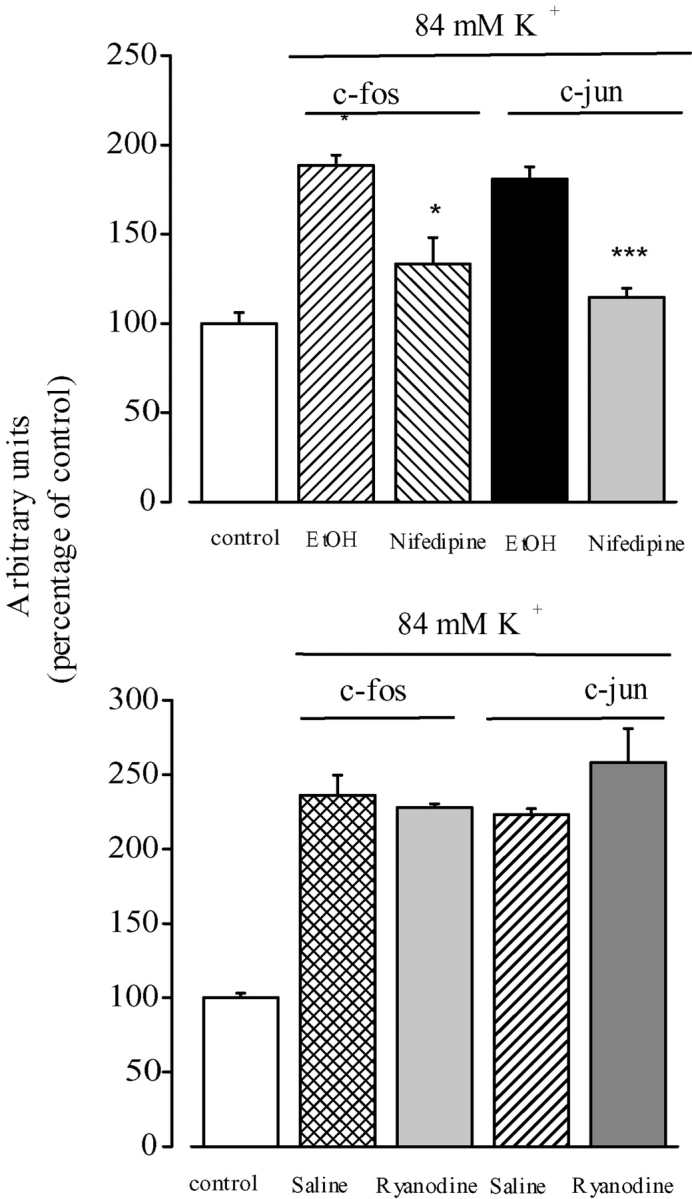
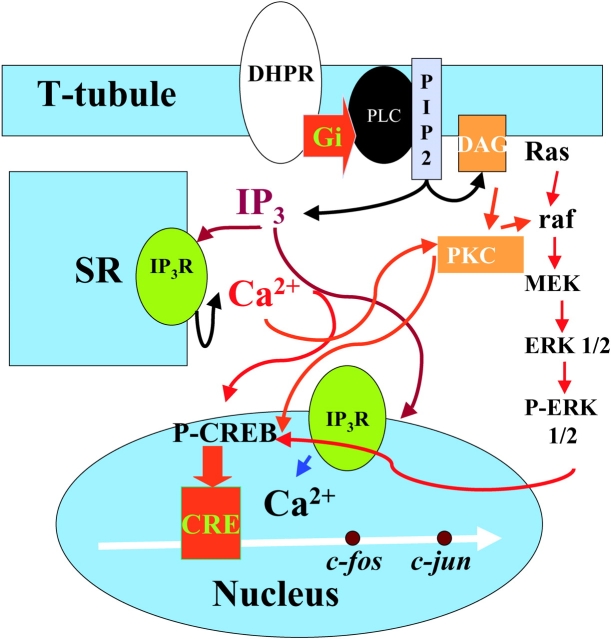
The dihydropyridine receptor (DHPR), normally a voltage-dependent calcium channel, functions in skeletal muscle essentially as a voltage sensor, triggering intracellular calcium release for excitation-contraction coupling. In addition to this fast calcium release, via ryanodine receptor (RYR) channels, depolarization of skeletal myotubes evokes slow calcium waves, unrelated to contraction, that involve the cell nucleus (Jaimovich, E., R. Reyes, J.L. Liberona, and J.A. Powell. 2000. Am. J. Physiol. Cell Physiol. 278:C998-C1010). We tested the hypothesis that DHPR may also be the voltage sensor for these slow calcium signals. In cultures of primary rat myotubes, 10 micro M nifedipine (a DHPR inhibitor) completely blocked the slow calcium (fluo-3-fluorescence) transient after 47 mM K(+) depolarization and only partially reduced the fast Ca(2+) signal. Dysgenic myotubes from the GLT cell line, which do not express the alpha(1) subunit of the DHPR, did not show either type of calcium transient following depolarization. After transfection of the alpha(1) DNA into the GLT cells, K(+) depolarization induced slow calcium transients that were similar to those present in normal C(2)C(12) and normal NLT cell lines. Slow calcium transients in transfected cells were blocked by nifedipine as well as by the G protein inhibitor, pertussis toxin, but not by ryanodine, the RYR inhibitor. Since slow Ca(2+) transients appear to be mediated by IP(3), we measured the increase of IP(3) mass after K(+) depolarization. The IP(3) transient seen in control cells was inhibited by nifedipine and was absent in nontransfected dysgenic cells, but alpha(1)-transfected cells recovered the depolarization-induced IP(3) transient. In normal myotubes, 10 micro M nifedipine, but not ryanodine, inhibited c-jun and c-fos mRNA increase after K(+) depolarization. These results suggest a role for DHPR-mediated calcium signals in regulation of early gene expression. A model of excitation-transcription coupling is presented in which both G proteins and IP(3) appear as important downstream mediators after sensing of depolarization by DHPR.


Figures

F<sc>igure</sc> 1.
Figure 1.
Effect of nifedipine on the depolarization-evoked calcium signals in primary muscle cultures. (A) Transmitted light image (top) and series of fluo-3 fluorescence images during a depolarization in primary cultured myotubes with a high potassium solution (47 mM) at the times indicated. In all experiments, the depolarization evoked a fast calcium transient (0.23–1.38 s), in this case, followed by a slow calcium transient (starting at 2.07 s). Note the brightly filled circle at the left of the frames (3.45–7.13 s) that most likely represents the calcium increase in a nucleus. Bar, 20 μm. (B) Transmitted light image (top) and series of fluo-3 fluorescence images during a depolarization with a high potassium (47 mM) solution at the times indicated in a myotube previously treated (20 min) with the Ca2+ channel blocker, nifedipine (10 μM), in the presence of 5 mM EGTA. The depolarization evoked a reduced fast calcium signal (0.5–1.5 s) whose time course was similar to what we observed in control myotubes. However, we did not observe the slow calcium signals in any of the 17 independent experiments done. Bar, 20 μm. (C) Relative fluorescence variation in a region of interest (ROI) during a depolarization stimulus shows both fast and slow calcium signals as found in 85% of the experiments analyzed. These data are taken from traces of a myotube, different from, but under the same conditions as, the one shown in A. (D) Relative fluorescence variation in a region of interest (ROI) during the depolarization evoked stimulus in a myotube previously (20 min) treated with 10 μM nifedipine. These data are taken from the images shown in B. No slow calcium transient was evident, whether the selected ROI was nuclear or cytosolic. Significantly, however, a reduced fast calcium signal (as shown) was observed in 35% of the experiments analyzed.
F<sc>igure</sc> 2.
Figure 2.
Effect of extracellular calcium, G protein, and calcium intracellular stores on the depolarization-evoked calcium signals in primary muscle cultures. (A) Relative fluorescence variation in an ROI after depolarization of a cell incubated in an external medium with no added calcium and 0.5 mM EGTA. Both fast and slow calcium signals are similar to control signals in normal calcium (see text for statistical analysis). (B) Time course of relative fluorescence after potassium depolarization in a cell previously incubated with 1 μg/ml pertussis toxin. Under this condition, an absence of a slow calcium transient was observed. Note that in most cases (e.g., Fig. 1 C, and Fig. 2 A) Ca2+ levels do not return completely to basal levels after the end of the slow transient peak. (C) Series of relative fluorescence analysis in independent cells after the addition of ryanodine (20 μM); after potassium depolarization in cells pretreated for 15–30 min with ryanodine (20 μM); or nifedipine (10 μM) plus ryanodine (20 μM) and after thapsigargin addition in ryanodine- plus nifedipine-treated cells.
F<sc>igure</sc> 3.
Figure 3.
Effect of nifedipine on IP3 mass changes following K+ depolarization in primary muscle cultures. Confluent plates of myotubes were washed three times with PBS and incubated during the times indicated with 47 mM K+, both in the presence (B and C) and in the absence (A) of extracellular calcium. The mass of IP3 in the extract was measured by radioreceptor assay. (A) Time course for the increase in the mass of IP3 in the absence of external calcium. The biphasic nature (an early fast and a later slower component) of the increase is clearer here than in B because measurements were made at shorter time intervals (2.0 s) during the onset of the transient. Values were expressed as the mean ± SD of at least three different samples from the same experiment. Paired t-tests were performed (**, P < 0.0006 [n = 4]; ***, P < 0.0004 [n = 4]) comparing each point with value at t = 0. (B) Samples incubated in the absence (filled circles) or in the presence (open circles) of 10 μM nifedipine. Note the slow kinetics of the transient increase in IP3 mass in the presence of nifedipine. Values were expressed as the mean ± SD of at least three different samples from a single experiment done in duplicate, for control and in the presence of nifedipine. Thus, these two curves can be directly compared. Paired t tests, comparing each point were performed (#, P < 0.0002 [n = 4] at t = 5 s; ##, P < 0.0001 [n = 4] at t = 15 s; @, P < 0.0005 [n = 3] at t = 30 s; &, P < 0.0047 [n = 3] at t = 45 s). (C) Mean values for control and depolarized cells after 15 s of high potassium exposure both in the absence and in the presence of 10 μM pertussis toxin. Error bars represent SD.
F<sc>igure</sc> 4.
Figure 4.
Immuno-detection of the α1 skeletal subunit of the DHPR in GLT-α1–transfected cells. Cells were fixed and incubated with an anti-α1 subunit of DHPR antibody (see materials and methods) and a rhodamine-conjugated secondary antibody. GLT-α1–transfected (A and B) cells are shown as both a projected reconstruction (A, Bar = 25 μm) or a series of confocal sections (B, Bar = 20 μm). The pattern of distribution of this subunit is punctate, especially near the surface (in A, small white dots and in B, at levels of 3.5, 4.0, and 4.5 μm) that most likely represent peripheral couplings. Some staining is found diffusely within the cytosol. Untransfected (C, Bar = 30 μm) and mock-transfected GLT cells (GLT-NEO) (D, Bar = 30 μm) were also evaluated for the presence and location of the α1 subunit of the DHPR. No reactivity above background was observed in either the untransfected or mock-transfected cells (C and D). The brightest optical sections were chosen from each sample. E. Western blots for the anti-α1 subunit of DHPR (top) in cell homogenates of GLT-α1–transfected cells, untransfected GLTs, and control NLT cells. The bottom panel shows immunoreactivity for anti–β-tubulin, a marker for protein loading. Note that the amount of protein loaded for NLT cells is one tenth of the amount needed for a similar reactivity for GLT-α1–transfected cells.
F<sc>igure</sc> 5.
Figure 5.
Depolarization-evoked calcium signals in GLT and GLT-α1 subunit–transfected cell lines. (A) Series of fluo-3 fluorescence images during the depolarization with a high potassium solution (47 mM) at the times indicated in nontransfected GLT dysgenic cells. These cells showed no fast or slow calcium signals (Bar = 10 μm). (B) Series of fluo-3 fluorescence images during a depolarization with a high potassium solution at the times indicated in GLT dysgenic cell lines transfected with the plasmid containing the α1 subunit of the DHPR. In contrast to what we observed in GLT myotubes and in the mock-transfected cells (GLT-NEO), we observed a slow depolarization-evoked calcium signal. Note that the slow transient (documented in D) lasts even longer than the one from primary cultures shown in Figs. 1 C and 2 A). Bar = 20 μm. (C) Relative fluorescence variation in an ROI during potassium depolarization at the time indicated in GLT cells. (D) Relative florescence in an ROI in GLT cells transfected with the α1 subunit. (E) Relative fluorescence variation in an ROI during potassium depolarization at the times indicated in control NLT cells.
F<sc>igure</sc> 6.
Figure 6.
Fluo-3 relative fluorescence variation in an ROI from GLT cells: GLT-NEO, GLT-α1, and GLT-α1 in the presence of nifedipine and ryanodine. (A) Relative fluorescence variation in an ROI during the depolarization-evoked stimulus (47mM K+) in previously fluo-3 a.m.–loaded GLT cells. Mock-transfected GLT (open squares); GLT-α1–transfected (filled triangles), and GLT-α1–transfected cells plus nifedipine (filled circles). (B) Relative fluorescence variation in an ROI during the depolarization evoked stimulus (47 mM K+) in previously fluo-3 a.m.–loaded GLT cells: GLT-α1–transfected, (filled triangles), GLT-α1–transfected cells plus ryanodine (10 μM) (filled circles), and GLT-α1–transfected cells plus nifedipine and ryanodine (open triangles). All these experiments were carried in the presence of 0.5 mM EGTA to reduce any Ca2+ entry from the medium.
F<sc>igure</sc> 7.
Figure 7.
Binding at equilibrium of 3H-IP3 to control and dysgenic cell homogenates. Confluent plates from (A) control cells and (B) dysgenic cells were washed three times with PBS, homogenized, and incubated in the presence of 3H-IP3 (10–200 nM) for 30–40 min. Total binding (filled circles) and nonspecific binding in the presence of 2 μM of IP3 (open circles) are indicated. Each experimental point represents the mean of three independent measurements. The Eadie-Scatchard analysis (inset) describes a single family of receptors in both cases with K d = 41.02 ± 9.90 nM and Bmax = 1.10 ± 0.12 pmol/mg protein for control cells and K d = 41.12 ± 12.03 nM, Bmax = 1.42 ± 0.15 pmol/mg protein for dysgenic cells.
F<sc>igure</sc> 8.
Figure 8.
IP3 mass changes upon KCl depolarization in NLT (filled diamonds and dotted lines), GLT (filled circles), and GLT-α1–transfected (open circles) cells. Confluent plates of cells were washed three times with PBS, and were incubated for the times indicated in 47 mM K+. The mass of IP3 in the extract once neutralized was measured by radioreceptor assay. Values were expressed as the mean ± SD of at least three independent experiments. Paired t tests were performed. **, P < 0.05 (n = 4); ***, P < 0.001 (n = 4).
F<sc>igure</sc> 9.
Figure 9.
Nifedipine inhibits K+ depolarization–induced increases in c-fos and c-jun transcription. (A) Myotubes were pretreated for 30 min with ethanol (vehicle for nifedipine) or with 10 μM nifedipine under resting conditions and depolarized with 84 mM potassium in a medium containing ethanol or nifedipine. The levels of c-fos and c-jun mRNAs were determined by Northern blot analysis of RT-PCR products. The results from both methods were normalized to GAPDH expression and presented as mean ± SE (n = 4–5) of the fold-induction effect of depolarization with respect to the control (no depolarization). (B) Myotubes were pretreated for 30 min with 20 μM ryanodine and depolarized in the presence of ryanodine. The levels of c-fos and c-jun mRNAs were determined in three experiments by RT-PCR. The results obtained at 15 min of exposure to high potassium in both cases are presented. Paired t tests were performed. *, P < 0.05; ***, P < 0.001.
F<sc>igure</sc> 10.
Figure 10.
Schematic description of receptors and pathways known to be involved in IP3-generated calcium signals and early gene regulation in muscle cells. The signaling pathway begins at the DHPR located in the T-tubule membrane; a heterotrimeric G protein with a Gi type subunit is proposed to interact with DHPR and to activate PLC to produce IP3 and DAG. IP3 will diffuse into the cytosol and reach IP3Rs located both at the SR membrane and at the nuclear envelope. Calcium release will occur independently into both cytosol and nucleoplasm and several calcium-dependent mechanisms will be activated. ERKs 1/2 will be phosphorylated in the cytosol and phosphorylated CREB (P-CREB) will increase inside the nucleus. Transcription of early genes such as c-jun will increase after P-CREB activation of a CRE box located upstream. All of the above steps are based on published data. Roles for the Ras-raf pathway upstream of ERKs and for PKC, activated by DAG as nuclear coactivator of CREB are postulated based on inhibition experiments (unpublished data). Red arrows denote activation and blue arrows indicate release.

References

    1. Carrasco, M.A., N. Riveros, J. Ríos, and E. Jaimovich. 2000. Expression of early genes in K+-depolarized rat myotubes in primary culture. J. Physiol. 523P:100P.
    1. Chomczynski, P., and N. Sacchi. 1987. Single-step method of RNA isolation by acid guanidinium thiocyanate-phenol-chloroform extraction. Anal. Biochem. 162:156–159. - PubMed
    1. Cognard, C., M. Rivet, and G. Raymond. 1990. The blockade of excitation/contraction coupling by nifedipine in patch-clamped rat skeletal muscle cells in culture. Pflugers Arch. 416:98–105. - PubMed
    1. Dolphin, A.C. 1999. L-Type calcium channel modulation. Adv. Second Messenger Phosphoprotein Res. 33:153–177. - PubMed
    1. Estrada, M., J.C. Cárdenas, J.L. Liberona, M.A. Carrasco, G.A. Mignery, P.D. Allen, and E. Jaimovich. 2001. Calcium transients in 1B5 myotubes lacking ryanodine receptors are related to inositol trisphosphate receptors. J. Biol. Chem. 276:22868–22874. - PubMed

Publication types

MeSH terms