

Gene expression profiles at different stages of human esophageal squamous cell carcinoma
- PMID: 12508342
- PMCID: PMC4728257
- DOI: 10.3748/wjg.v9.i1.9
Gene expression profiles at different stages of human esophageal squamous cell carcinoma
Abstract
Aim: To characterize the gene expression profiles in different stages of carcinogenesis of esophageal epithelium.
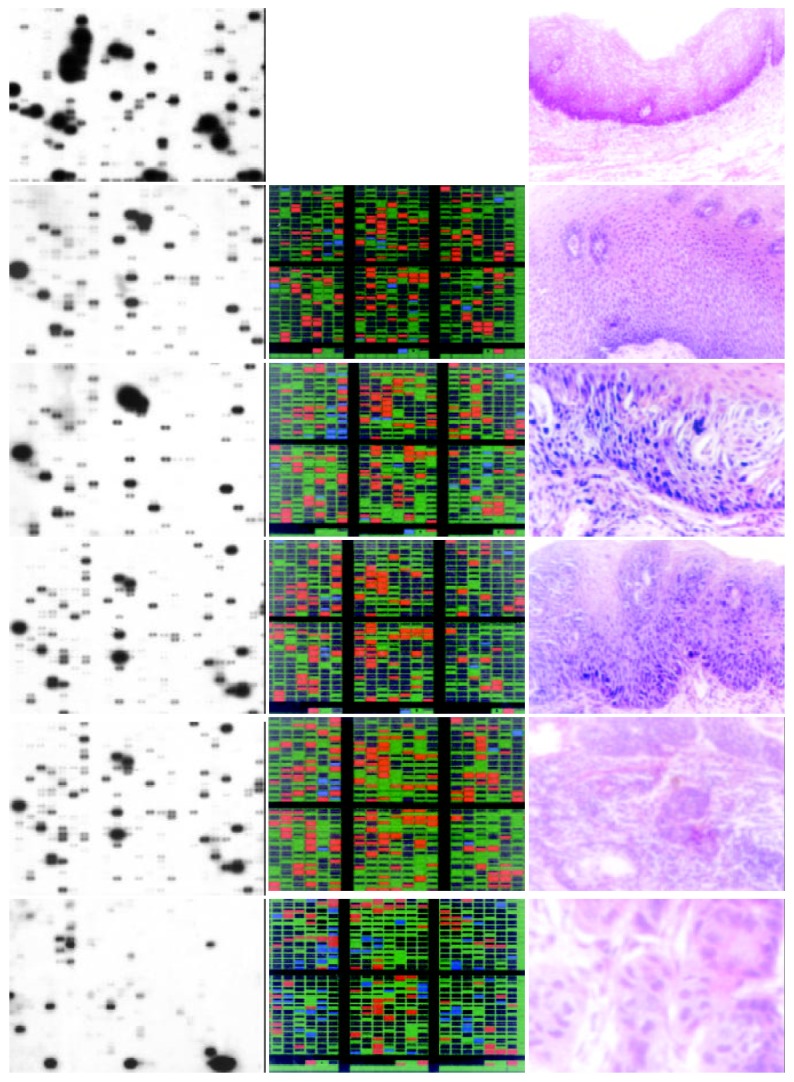
Methods: A microarray containing 588 cancer related genes was employed to study the gene expression profile at different stages of esophageal squamous cell carcinoma including basal cell hyperplasia, high-grade dysplasia, carcinoma in situ, early and late cancer. Principle component analysis was performed to search the genes which were important in carcinogenesis.
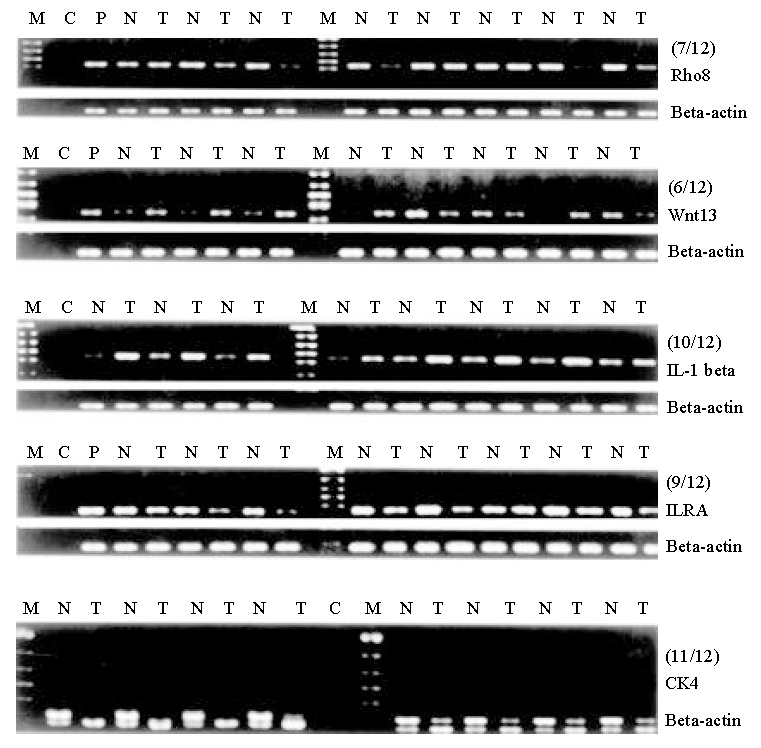
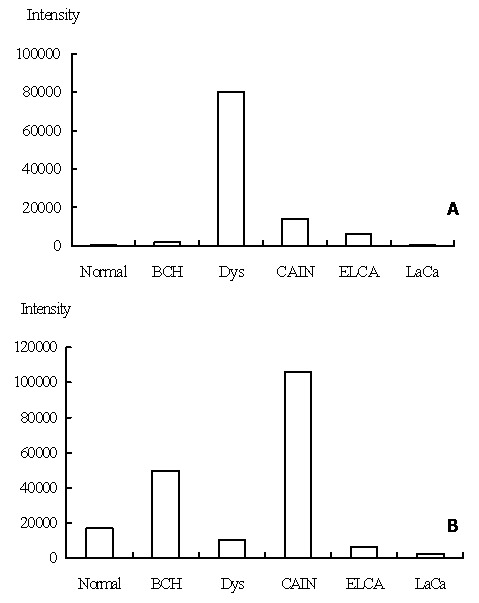
Results: More than 100 genes were up or down regulated in esophageal epithelial cells during the stages of basal cell hyperplasia, high-grade dysplasia, carcinoma in situ, early and late cancer. Principle component analysis identified a set of genes which may play important roles in the tumor development. Comparison of expression profiles between these stages showed that some genes, such as P160ROCK, JNK2, were activated and may play an important role in early stages of carcinogenesis.
Conclusion: These findings provided an esophageal cancer-specific and stage-specific expression profiles, showing that complex alterations of gene expression underlie the development of malignant phenotype of esophageal cancer cells.
Figures
References
-
- DeRisi J, Penland L, Brown PO, Bittner ML, Meltzer PS, Ray M, Chen Y, Su YA, Trent JM. Use of a cDNA microarray to analyse gene expression patterns in human cancer. Nat Genet. 1996;14:457–460. - PubMed
-
- Schena M, Shalon D, Davis RW, Brown PO. Quantitative monitoring of gene expression patterns with a complementary DNA microarray. Science. 1995;270:467–470. - PubMed
-
- Fuller GN, Rhee CH, Hess KR, Caskey LS, Wang R, Bruner JM, Yung WK, Zhang W. Reactivation of insulin-like growth factor binding protein 2 expression in glioblastoma multiforme: a revelation by parallel gene expression profiling. Cancer Res. 1999;59:4228–4232. - PubMed
-
- Sgroi DC, Teng S, Robinson G, LeVangie R, Hudson JR, Elkahloun AG. In vivo gene expression profile analysis of human breast cancer progression. Cancer Res. 1999;59:5656–5661. - PubMed
-
- Johoson RA, Wichern DW Applied multivariate statistical analysis, Prentice Hall, Inc., New York. 1982.
Publication types
MeSH terms
Substances
LinkOut - more resources
Full Text Sources
Other Literature Sources
Medical
Miscellaneous
