Review
. 2003 Jan;91 Spec No(2):155-72.
doi: 10.1093/aob/mcf244.

Functional electron microscopy in studies of plant response and adaptation to anaerobic stress

Affiliations
Review

Functional electron microscopy in studies of plant response and adaptation to anaerobic stress

Boris B Vartapetian et al. Ann Bot. 2003 Jan.

Abstract

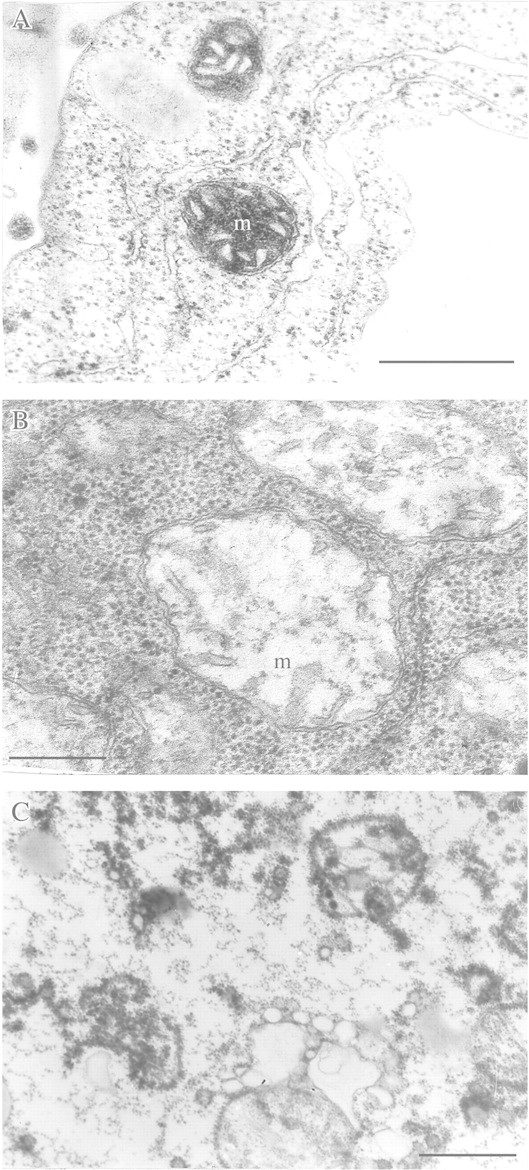
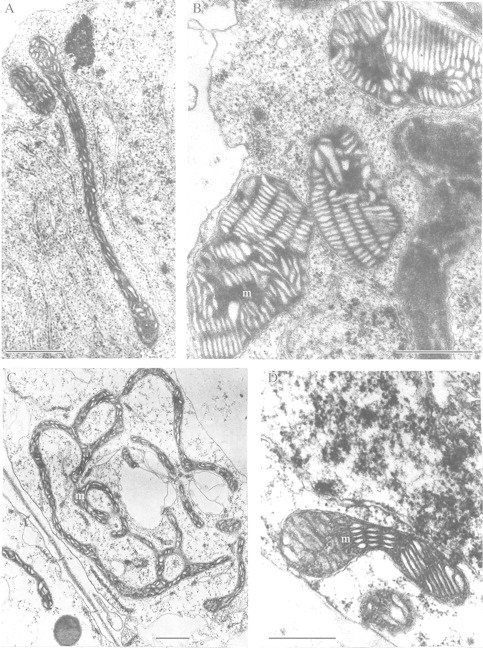
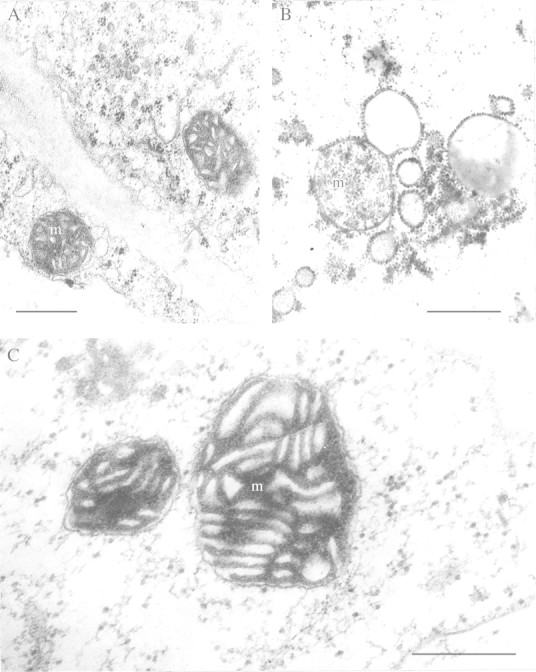
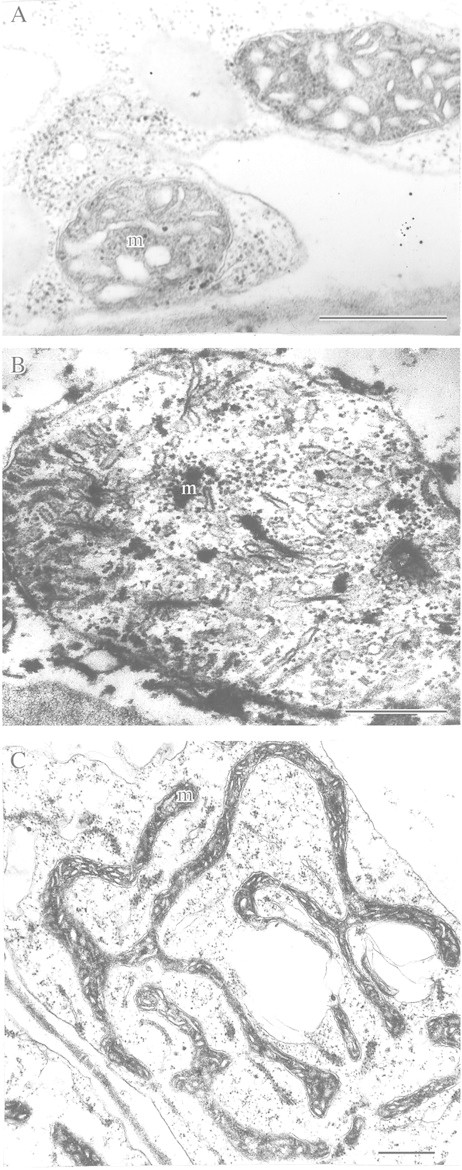
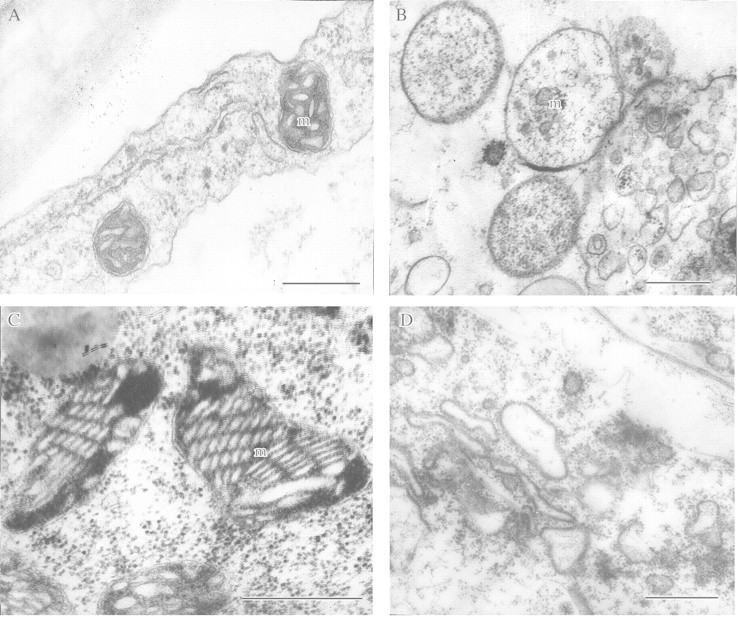
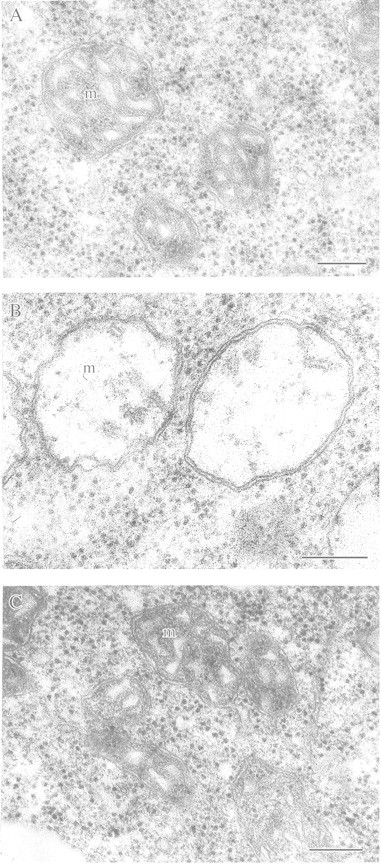
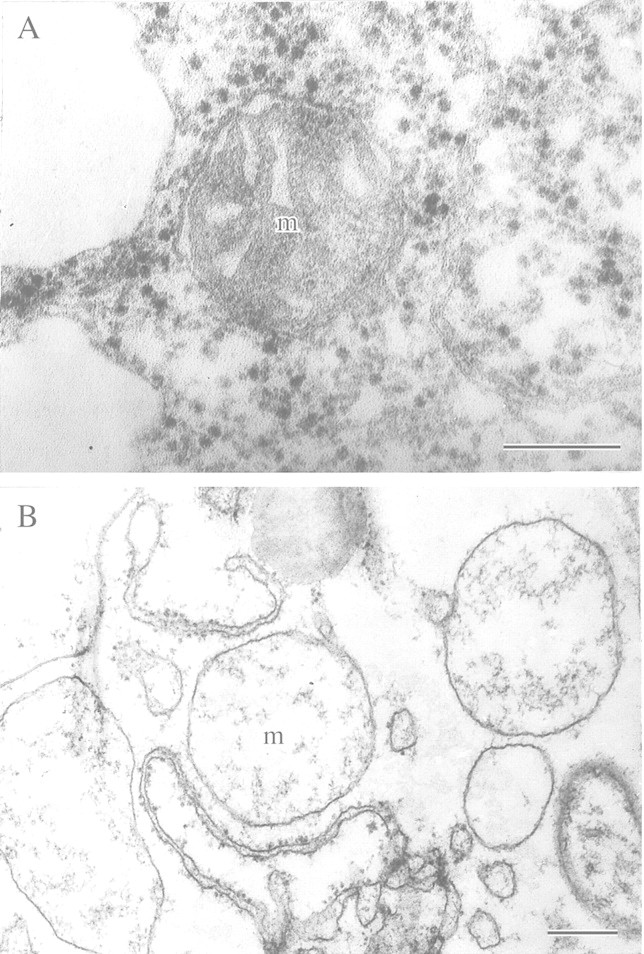
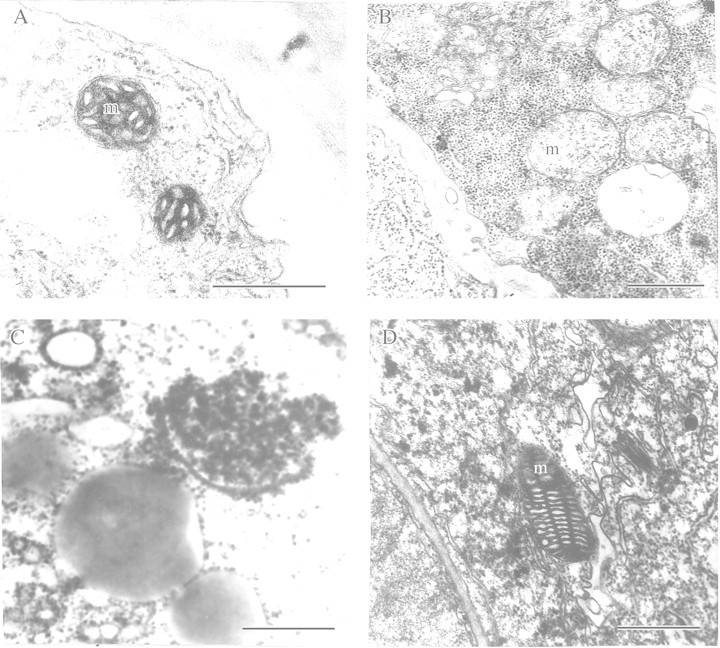
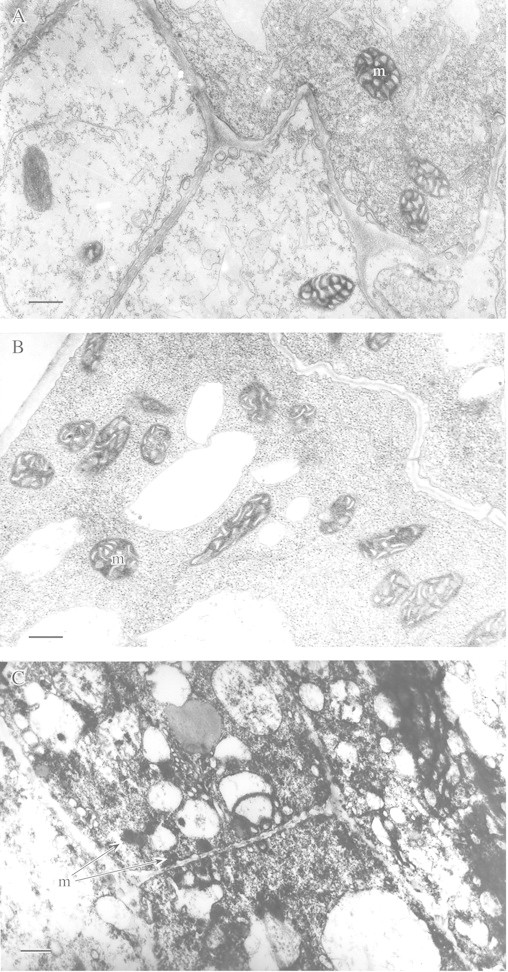
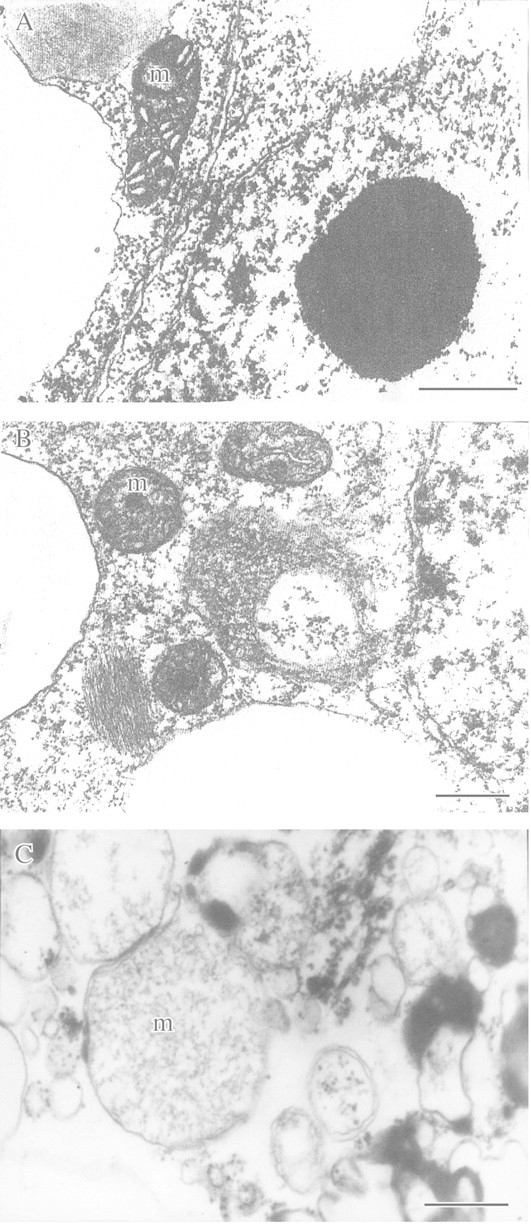
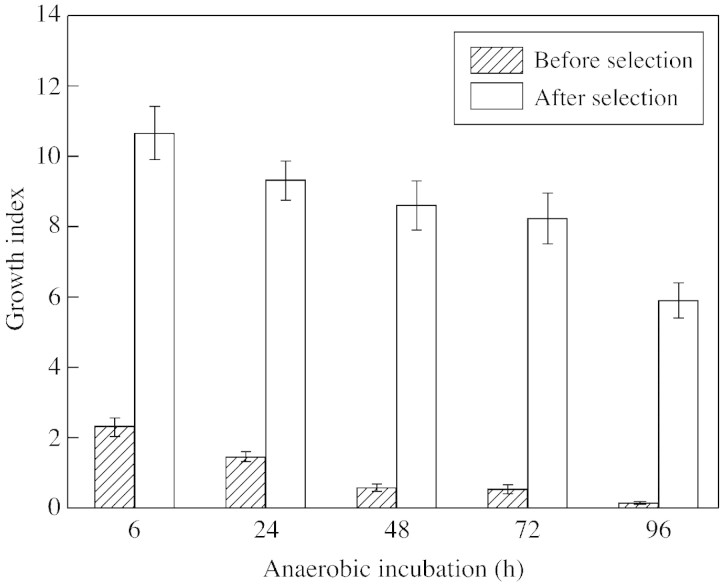
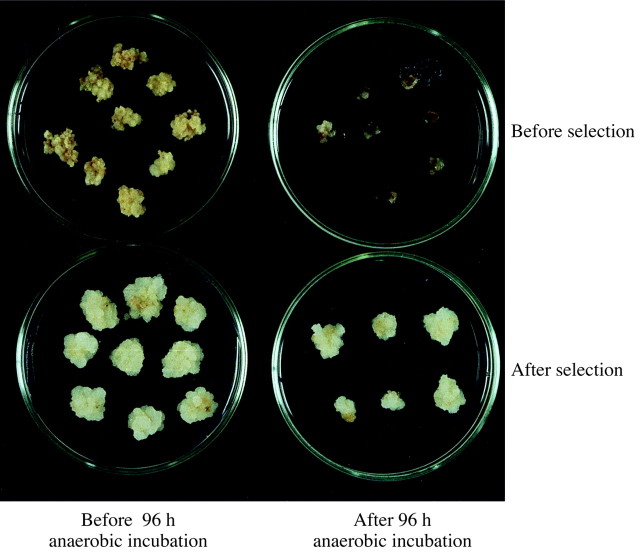
This article reviews the contribution made by functional electron microscopy towards identifying and understanding the reactions of plant roots and shoots to anaerobic stress. Topics examined include: (1) unexpected hypersensitivity, rather than hyper-resistance, to anoxia of root tips of flooding-tolerant plants; (2) protective, rather than damaging, effects of a stimulated energy metabolism (glycolysis and fermentation) under anaerobic conditions; (3) the concept of two main strategies of plant adaptation to anaerobic environments, namely avoidance of anaerobiosis on the whole plant level, termed 'apparent' tolerance, and metabolic adaptation at the cellular and molecular levels, termed 'true' tolerance; (4) the importance of protein synthesis during hypoxia and anoxia for enhanced energy production and metabolic adaptation; (5) a general adaptive syndrome in plants to stress at the ultrastructural level and a possible molecular mechanism for its realization under anoxia; (6) the physiological role of anaerobically synthesized lipids and nitrate as alternative electron acceptors in an oxygen-free medium; and (7) the selection of cell lines derived from callus cultures that possess enhanced tolerance to anoxia and can regenerate whole plants with improved tolerance of soil waterlogging.


Figures

None
Fig. 1. Destructive and degradative rearrangement of mitochondrial ultrastructure under anaerobic stress. A, Mitochondrial ultrastructure of a detached root Cucurbita pepo under aerobic conditions (control). B, Reversible destruction after 6 h anaerobic incubation. C, Irreversible degradation after 15 h anaerobic incubation. m, Mitochondrion. Bar = 0·5 µm.
None
Fig. 2. Adaptive rearrangements of plant mitochondrial ultrastructure under anaerobic stress. A, Elongated mitochondria after 24 h anaerobic incubation of detached root of Cucurbita pepo in the presence of exogenous glucose (3 %). B, Mitochondria of rice coleoptile developing stacks of parallel cristae with a dense matrix after 5 d anaerobic incubation. C, Mitochondria taking the form of mitochondrial reticulum after 72 h anaerobic incubation of detached root of C. pepo in the presence of exogenous glucose (3 %). D, Dumb‐bell shaped mitochondria in detached coleoptile of O. sativa after 48 h anaerobic incubation in the presence of exogenous KNO3 (10 mm). m, Mitochondrion. Bars = 0·5 µm.
None
Fig. 3. Degradative and adaptive rearrangements of mitochondrial ultrastructure of detached rice coleoptiles with and without glucose feeding under anoxia. A, After 6 d anaerobic seed germination (control). B, After 48 h anaerobic incubation of detached coleoptile without glucose feeding. C, After 5 d anaerobic incubation of detached coleoptile with glucose feeding (0·5 %). m, Mitochondrion. Bars = 0·5 µm.
None
Fig. 4. Destructive and adaptive rearrangements of mitochondrial ultrastructure of detached pumpkin roots with and without glucose feeding under anoxia. A, Under aerobic conditions (control). B, After 10 h anaerobic incubation without glucose feeding. C, After 72 h anaerobic incubation with glucose feeding (3 %). m, Mitochondrion. Bar = 0·5 µm.
None
Fig. 5. Inhibition of anaerobic protein synthesis in detached rice coleoptile cells has destabilized mitochondrial fine structure. A, Under aerobic conditions (control). B, After 48 h anaerobic incubation without exogenous glucose. C, After 72 h anaerobic incubation in the presence of exogenous glucose (2 %). D, After anaerobic incubation in the presence of cycloheximide (10–5 m) and glucose (2 %). m, Mitochondrion. Bars = 0·5 µm.
None
Fig. 6. Reversible destruction and restoration of mitochondrial ultrastructure of wheat seedling leaves during short‐term anoxia. A, Under aerobic conditions (control). B, After 90 min anaerobic incubation (mitochondria are swollen). C, After 3 h of anaerobic incubation (mitochondria are restored to a normal appearance). m, Mitochondria. Bar = 0·5 µm.
None
Fig. 7. Mitochondria of wheat seedling leaves after anaerobic incubation in the presence of exogenous glucose or cycloheximide. A, After 90 min of anaerobiosis in the presence of exogenous glucose (2 %). B, After 6 h of anaerobiosis in the presence of cycloheximide (10–5 m). m, Mitochondrion. Bars = 0·5 µm.
None
Fig. 8. Ultrastructure of detached rice coleoptile mitochondria after anaerobic incubation in the presence of exogenous KCl (10 mm) or KNO3 (10 mm). A, Before anaerobic incubation (control). B, After 24 h anaerobic incubation in the presence of KCI. C, After 48 h anaerobic incubation in the presence of KCI. D, After 48 h anaerobic incubation in the presence of KNO3. m, Mitochondrion. Bars = 0·5 µm.
None
Fig. 9. Ultrastructure of coleoptile cells after anaerobic germination of rice seeds (A, B) and after anaerobic incubation of rice detached coleoptiles (C). Five‐day old (A) and 8‐d‐old (B) coleoptiles; cytoplasm without lipid bodies. C, After 48 h incubation; lipid bodies in collapsed cells are indicated by arrows. m, Mitochondrion. Bars = 0·5 µm.
None
Fig. 10. Ultrastructure of callus cells of Saccharum officinarum with and without glucose feeding under anoxia. A, Before anaerobic incubation (control). B, After 96 h anaerobic incubation in the presence of exogenous glucose (3 %). C, After 48 h anaerobic incubation in glucose‐free medium. m, Mitochondrion. Bars = 0.5 µm.
None
Fig. 11. Growth index after 1 month of post‐anaerobic growth of cell lines of Saccharum officinarum before and after selection of tolerant cells. Data are means ± standard errors.
None
Fig. 12. Post‐anaerobic growth of callus of Saccharum officinarum; only selected cells lines survived anoxic treatment for 96 h.

References

    1. AldrichHC, Ferl RJ, Hils MH, Akin DE.1985. Ultrastructural correlates of anaerobic stress in corn roots. Tissue and Cell 17: 341–348. - PubMed
    1. AndreevVYu, Generozova IP, Vartapetian BB.1991. Energy status and mitochondrial ultrastructure of excised pea root at anoxia and postanoxia. Plant Physiology and Biochemistry 29: 171–176.
    1. AndreevaIN, Grineva GM.1970. Ultrastructure of endoplasmic reticulum in the cells of maize root under conditions of hypoxia. Plant Physiology 17: 956–961 (in Russian).
    1. AndrewsCJ.1997. A comparison of glycolytic activity in wheat and two forage grasses in relation to their tolerance to ice encasement. Annals of Botany 79 (Suppl. A): 87–92.
    1. AndrewsCJ, Pomeroy MK.1981. The effect of flooding pretreatment on cold hardiness and survival of winter cereals in ice encasement. Canadian Journal of Plant Science 61: 507–513.

Publication types