

Susceptibility of lysosomes to rupture is a determinant for plasma membrane disruption in tumor necrosis factor alpha-induced cell death
- PMID: 12509464
- PMCID: PMC151543
- DOI: 10.1128/MCB.23.2.665-676.2003
Susceptibility of lysosomes to rupture is a determinant for plasma membrane disruption in tumor necrosis factor alpha-induced cell death
Abstract
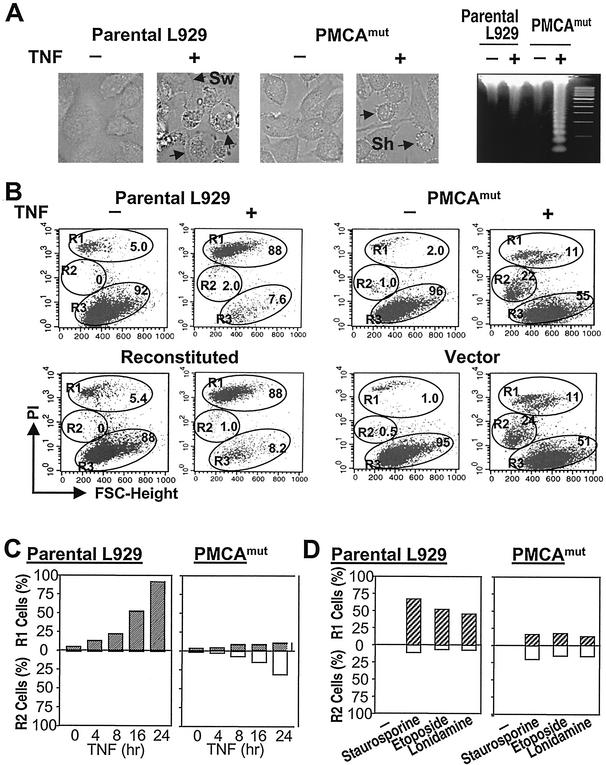
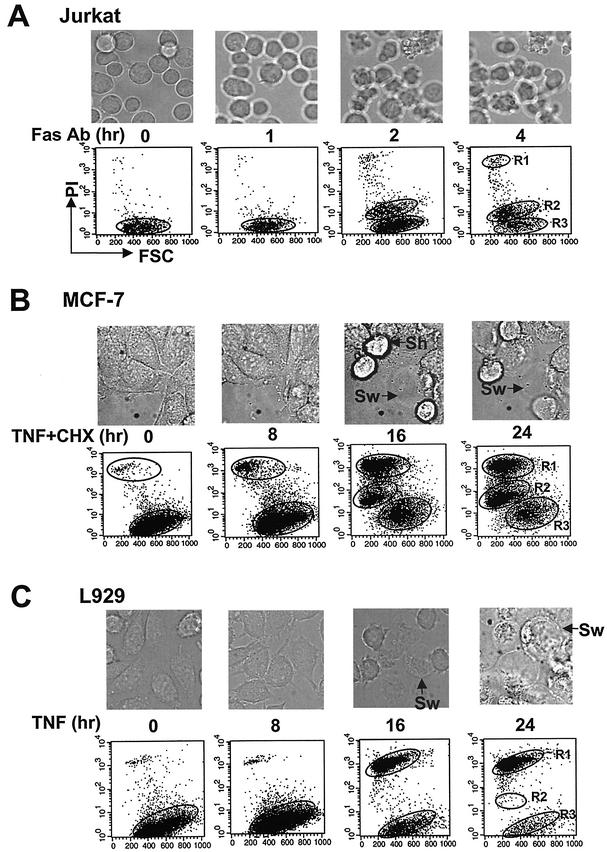
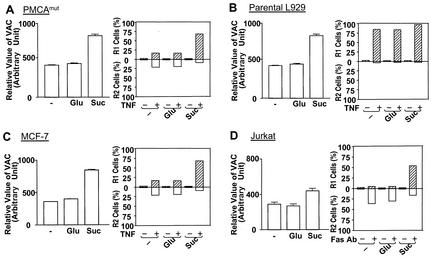
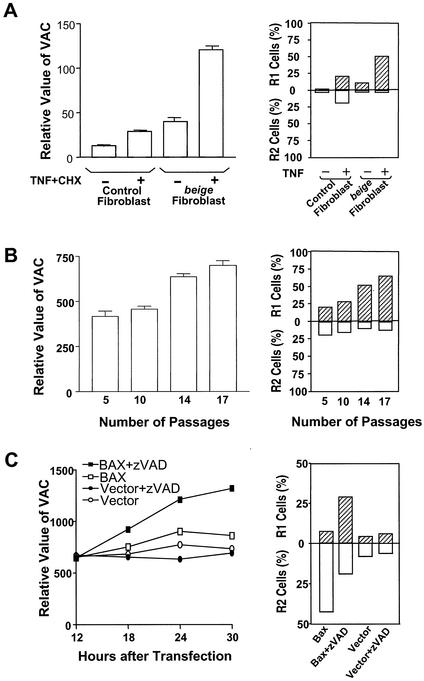
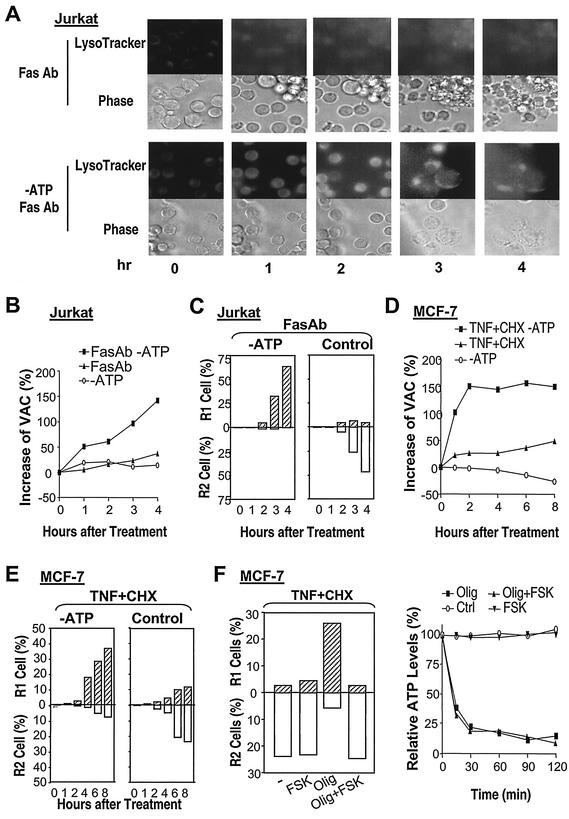
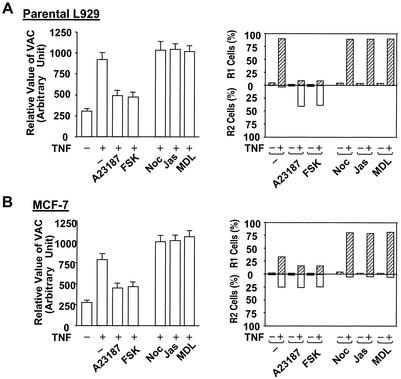
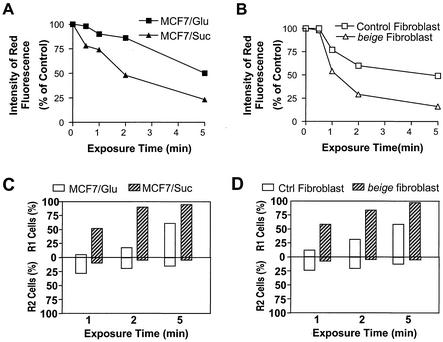
Since a release of intracellular contents can induce local inflammatory responses, mechanisms that lead to loss of plasma membrane integrity in cell death are important to know. We showed previously that deficiency of the plasma membrane Ca2+ ATPase 4 (PMCA4) in L929 cells impaired tumor necrosis factor alpha (TNF-alpha)-induced enlargement of lysosomes and reduced cell death. The lysosomal changes can be determined by measuring the total volume of intracellular acidic compartments per cell (VAC), and we show here that inhibition of the increase in VAC due to PMCA4 deficiency not only reduced cell death but also converted TNF-alpha-induced cell death from a process involving disruption of the plasma membrane to a cell demise with a nearly intact plasma membrane. The importance of the size of lysosomes in determining plasma membrane integrity during cell death was supported by the observations that chemical inhibitors that reduce VAC also reduced the plasma membrane disruption induced by TNF-alpha in wild-type L929 cells, while increases in VAC due to genetic mutation, senescence, cell culture conditions, and chemical inhibitors all changed the morphology of cell death from one with an originally nearly intact plasma membrane to one with membrane disruption in a number of different cells. Moreover, the ATP depletion-mediated change from apoptosis to necrosis is also associated with the increases of VAC. The increase in lysosomal size may due to intracellular self-digestion of dying cells. Big lysosomes are easy to rupture, and the release of hydrolytic enzymes from ruptured lysosomes can cause plasma membrane disruption.
Figures
Similar articles
-
Resistance to tumor necrosis factor-induced cell death mediated by PMCA4 deficiency.Mol Cell Biol. 2001 Dec;21(24):8276-88. doi: 10.1128/MCB.21.24.8276-8288.2001. Mol Cell Biol. 2001. PMID: 11713265 Free PMC article.
-
Tumor necrosis factor-alpha-associated lysosomal permeabilization is cathepsin B dependent.Am J Physiol Gastrointest Liver Physiol. 2002 Oct;283(4):G947-56. doi: 10.1152/ajpgi.00151.2002. Am J Physiol Gastrointest Liver Physiol. 2002. PMID: 12223355
-
Aryl hydrocarbon receptor modulation of tumor necrosis factor-alpha-induced apoptosis and lysosomal disruption in a hepatoma model that is caspase-8-independent.J Biol Chem. 2006 Apr 21;281(16):10954-67. doi: 10.1074/jbc.M508383200. Epub 2006 Jan 30. J Biol Chem. 2006. PMID: 16446372
-
Heat shock protein 70 promotes cancer cell viability by safeguarding lysosomal integrity.Cell Cycle. 2004 Dec;3(12):1484-5. doi: 10.4161/cc.3.12.1287. Epub 2004 Dec 6. Cell Cycle. 2004. PMID: 15539949 Review.
-
Lysosomes and plasma membrane repair.Curr Top Membr. 2019;84:1-16. doi: 10.1016/bs.ctm.2019.08.001. Epub 2019 Sep 3. Curr Top Membr. 2019. PMID: 31610859 Review.
Cited by
-
Phosphatidic acid mediates the targeting of tBid to induce lysosomal membrane permeabilization and apoptosis.J Lipid Res. 2012 Oct;53(10):2102-2114. doi: 10.1194/jlr.M027557. Epub 2012 Jul 3. J Lipid Res. 2012. PMID: 22761256 Free PMC article.
-
LRRK2 and its substrate Rab GTPases are sequentially targeted onto stressed lysosomes and maintain their homeostasis.Proc Natl Acad Sci U S A. 2018 Sep 25;115(39):E9115-E9124. doi: 10.1073/pnas.1812196115. Epub 2018 Sep 12. Proc Natl Acad Sci U S A. 2018. PMID: 30209220 Free PMC article.
-
Calcium Phosphate-Induced Injury in Kidney Tubular Cells-Supersaturated Solution vs Preformed Crystals.J Biochem Mol Toxicol. 2025 Feb;39(2):e70145. doi: 10.1002/jbt.70145. J Biochem Mol Toxicol. 2025. PMID: 39887523
-
Pterostilbene-induced tumor cytotoxicity: a lysosomal membrane permeabilization-dependent mechanism.PLoS One. 2012;7(9):e44524. doi: 10.1371/journal.pone.0044524. Epub 2012 Sep 5. PLoS One. 2012. PMID: 22957077 Free PMC article.
-
Synergistic Anticancer Action of Lysosomal Membrane Permeabilization and Glycolysis Inhibition.J Biol Chem. 2016 Oct 28;291(44):22936-22948. doi: 10.1074/jbc.M116.752113. Epub 2016 Sep 1. J Biol Chem. 2016. PMID: 27587392 Free PMC article.
References
-
- Andrews, N. W. 2000. Regulated secretion of conventional lysosomes. Trends. Cell Biol. 10:316-321. - PubMed
-
- Beyaert, R., and W. Fiers. 1994. Molecular mechanisms of tumor necrosis factor-induced cytotoxicity. What we do understand and what we do not. FEBS Lett. 340:9-16. - PubMed
-
- Brunk, U. T., H. Dalen, K. Roberg, and H. B. Hellquist. 1997. Photo-oxidative disruption of lysosomal membranes causes apoptosis of cultured human fibroblasts. Free Radic. Biol. Med. 23:616-626. - PubMed
-
- Brunk, U. T., and I. Svensson. 1999. Oxidative stress, growth factor starvation and Fas activation may all cause apoptosis through lysosomal leak. Redox Rep. 4:3-11. - PubMed
Publication types
MeSH terms
Substances
Grants and funding
LinkOut - more resources
Full Text Sources
Miscellaneous