. 2003 Feb 4;100(3):975-80.
doi: 10.1073/pnas.0235349100. Epub 2002 Dec 30.

Hysteresis drives cell-cycle transitions in Xenopus laevis egg extracts

Affiliations

Hysteresis drives cell-cycle transitions in Xenopus laevis egg extracts

Wei Sha et al. Proc Natl Acad Sci U S A. .

Abstract

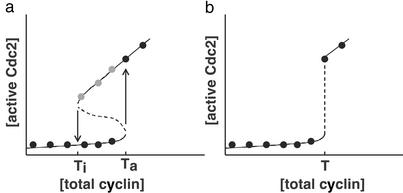
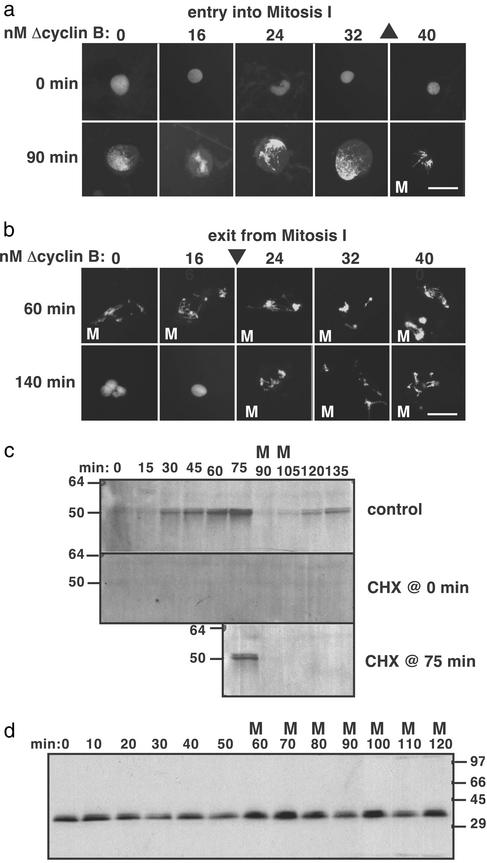
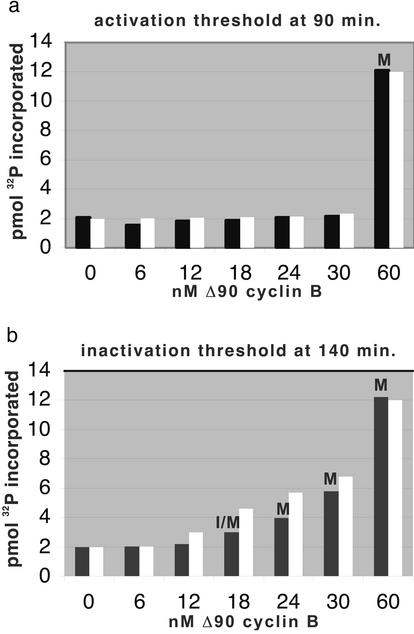
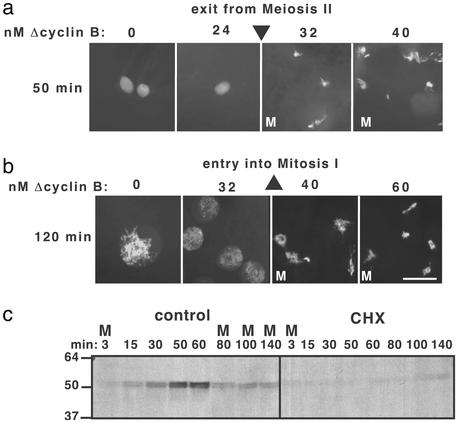
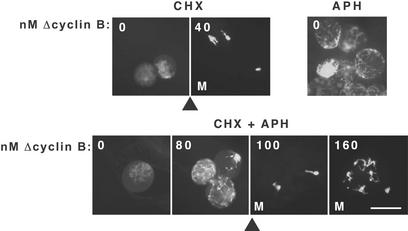
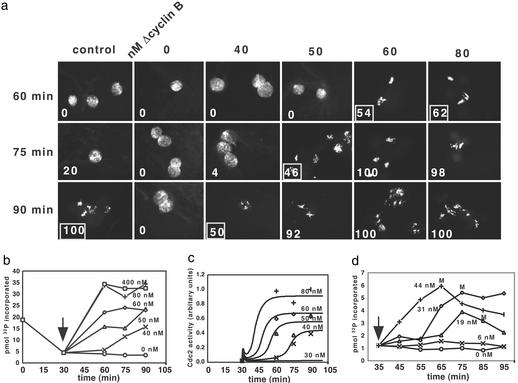
Cells progressing through the cell cycle must commit irreversibly to mitosis without slipping back to interphase before properly segregating their chromosomes. A mathematical model of cell-cycle progression in cell-free egg extracts from frog predicts that irreversible transitions into and out of mitosis are driven by hysteresis in the molecular control system. Hysteresis refers to toggle-like switching behavior in a dynamical system. In the mathematical model, the toggle switch is created by positive feedback in the phosphorylation reactions controlling the activity of Cdc2, a protein kinase bound to its regulatory subunit, cyclin B. To determine whether hysteresis underlies entry into and exit from mitosis in cell-free egg extracts, we tested three predictions of the Novak-Tyson model. (i) The minimal concentration of cyclin B necessary to drive an interphase extract into mitosis is distinctly higher than the minimal concentration necessary to hold a mitotic extract in mitosis, evidence for hysteresis. (ii) Unreplicated DNA elevates the cyclin threshold for Cdc2 activation, indication that checkpoints operate by enlarging the hysteresis loop. (iii) A dramatic "slowing down" in the rate of Cdc2 activation is detected at concentrations of cyclin B marginally above the activation threshold. All three predictions were validated. These observations confirm hysteresis as the driving force for cell-cycle transitions into and out of mitosis.


Figures

Figure 1
Figure 1
Steady-state activity of Cdc2 in a frog egg extract plotted as a function of total concentration of cyclin. A threshold concentration of cyclin for activation of Cdc2 was demonstrated by Solomon et al. (4). These data are schematically represented by the black circles. (a) Theoretical prediction of bistability and hysteresis in the Cdc2 control system (17, 18). An S-shaped curve is delineated by two thresholds, Ti and Ta. For a fixed concentration of cyclin between Ti and Ta, the control system has two stable steady states (black and gray circles), corresponding to interphase (low Cdc2 activity) and mitosis (high Cdc2 activity), separated by an unstable steady state (intermediate Cdc2 activity along the dashed line). If cyclin concentration is elevated above its activation threshold the extract will transit irreversibly from interphase into mitosis (↑). To make the reverse transition from mitosis back to interphase (↓), cyclin concentration must drop below the inactivation threshold. The stable steady states represented by gray circles have not previously been observed experimentally. (b) In an alternative account of the data by Goldbeter (19), the activation threshold and inactivation threshold concentrations of cyclin are identical. Both models are consistent with the measurements of Solomon et al. (4).
Figure 2
Figure 2
The threshold concentration of cyclin B to enter mitosis is higher than the threshold to exit mitosis. Cycling egg extracts in interphase of cycle 1 were supplemented with Δcyclin B (at t = 0). (a) To measure the activation threshold, CHX was added immediately (t = 0). (b) To measure the inactivation threshold, CHX was added 60 min later when the extract was in mitosis. Fluorescence micrographs of sperm nuclei are depicted. Triangles denote activation threshold (▴) and inactivation threshold (▾) concentrations. (Scale bars = 50 μm.) (c) Extracts prepared as in a and b without exogenous cyclin were immunoblotted for endogenous cyclin B1. (d) A CHX-treated CSF-released extract was supplemented with 150 nM Δcyclin B during interphase (t = 0). Samples were collected and blotted for Δcyclin B. Extracts are labeled M when >90% nuclei on a slide appear mitotic (condensed chromatin, no nuclear envelope). In unlabeled extracts, >90% nuclei were in interphase. Migration of molecular mass standards (in kDa) is indicated.
Figure 3
Figure 3
The amplitude of the down jump in Cdc2 activity is less than that of the up jump. Samples from cycling extracts prepared as in Fig. 2 were analyzed for Cdc2 kinase activity as measured by incorporation of 32P from [γ-32P]ATP into histone H1. (a) Activation threshold as in Fig. 2a. (b) Inactivation threshold as in Fig. 2b. Experimental data (black bars) are compared with numerical simulations of the Novak–Tyson model (white bars). Extracts are labeled M when >90% nuclei on a slide appear mitotic (condensed chromatin, no nuclear envelope). In extract labeled I/M (b), 58% nuclei were in mitosis.
Figure 4
Figure 4
The threshold concentration of cyclin B to enter mitosis I is higher than the threshold to exit meiosis II. (a) To measure the cyclin threshold for exit from meiosis II, CSF extract was supplemented with CHX and Δcyclin B, then released from CSF arrest by addition of calcium (at t = 0) and photographed under fluorescence microscopy at 50 min. (b) To measure the cyclin threshold for entry into mitosis I, Δcyclin B was added to CHX-treated CSF-released extract at 50 min (when extract was in interphase), and nuclei were photographed at 120 min. Thresholds in a and b were measured in the same extract preparation. Triangles denote threshold concentrations. (Scale bar = 50 μm.) (c) Extracts prepared as in a and b, without exogenous cyclin, were immunoblotted for endogenous cyclin B1.
Figure 5
Figure 5
The cyclin threshold for Cdc2 activation is raised by unreplicated DNA. CSF-released extracts containing 1,200 nuclei per μl were supplemented at 0 min with CHX, APH, or both (CHX + APH). ΔCyclin B was added at 40 min (interphase). Photographs of sperm nuclei were taken under fluorescence microscopy at 140 min. Extracts are labeled M when >90% nuclei on a slide appear mitotic. Triangle denotes threshold concentration of cyclin. (Scale bar = 50 μm.)
Figure 6
Figure 6
Cdc2 activation exhibits a critical slowing down near the activation threshold concentration of cyclin B. CSF-released extracts were supplemented with CHX at 0 min and Δcyclin B at 30 min (interphase). Control extract lacking CHX entered mitosis at 90 min. Samples were collected every 15 min for microscopic analysis of nuclear morphology (a) and histone H1 kinase activity (b). In a, at each time is indicated the percent of nuclei (of 50 scored) that had undergone nuclear envelope breakdown and chromatin condensation. The extract was qualitatively scored as entering mitosis (boxed numbers) when >40% of the nuclei had condensed chromatin and no nuclear envelope. (c) Experimental data (symbols) from b are displayed alongside simulations of the Novak–Tyson model (curves). (d) Histone H1 kinase activity measured in an extract collected every 10 min with varying concentrations of Δcyclin B added at 35 min. M = time when nuclear morphology first indicated mitosis. Arrows denote addition of Δcyclin B in b and d. The preparation of Δcyclin B used in d was more active than the others, resulting in a lower activation threshold.

Comment in

  • Hysteresis meets the cell cycle.
    Solomon MJ. Solomon MJ. Proc Natl Acad Sci U S A. 2003 Feb 4;100(3):771-2. doi: 10.1073/pnas.0430083100. Epub 2003 Jan 27. Proc Natl Acad Sci U S A. 2003. PMID: 12552095 Free PMC article. Review. No abstract available.

References

    1. Murray A W, Kirschner M W. Nature. 1989;339:275–280. - PubMed
    1. Murray A W. Methods Cell Biol. 1991;36:581–605. - PubMed
    1. Gautier J, Minshull J, Lohka M, Glotzer M, Hunt T, Maller J. Cell. 1990;1990:487–494. - PubMed
    1. Solomon M J, Glotzer M, Lee T H, Phillippe M, Kirschner M W. Cell. 1990;63:1013–1024. - PubMed
    1. Mueller P R, Coleman T R, Dunphy W G. Mol Biol Cell. 1995;6:119–134. - PMC - PubMed

Publication types

LinkOut - more resources