. 2003 Jan;15(1):79-92.
doi: 10.1105/tpc.004838.

Altered cell cycle distribution, hyperplasia, and inhibited differentiation in Arabidopsis caused by the D-type cyclin CYCD3

Affiliations

Altered cell cycle distribution, hyperplasia, and inhibited differentiation in Arabidopsis caused by the D-type cyclin CYCD3

Walter Dewitte et al. Plant Cell. 2003 Jan.

Abstract

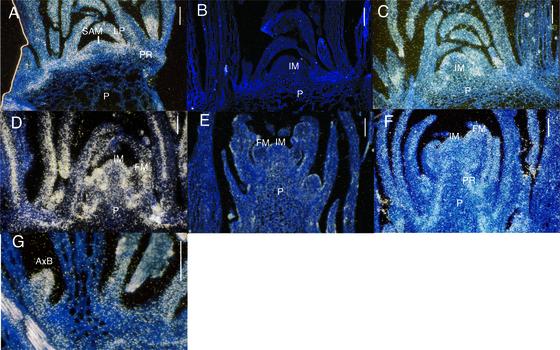
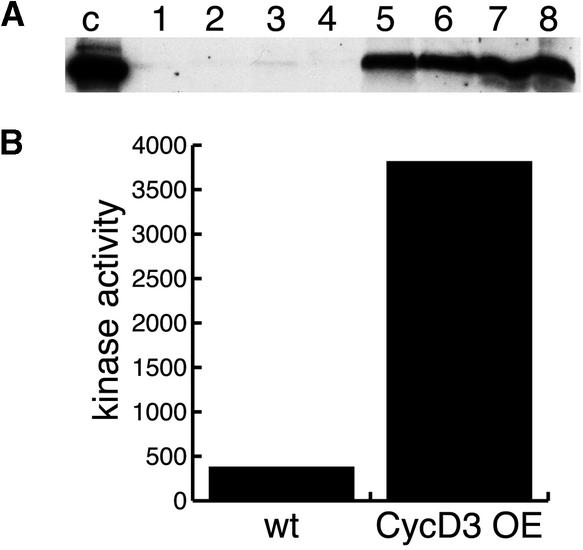
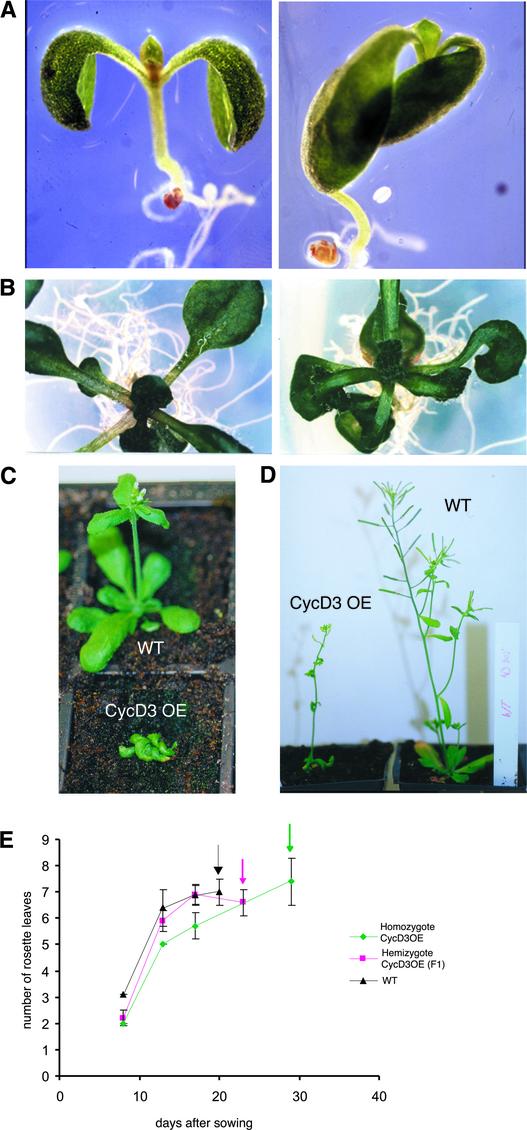
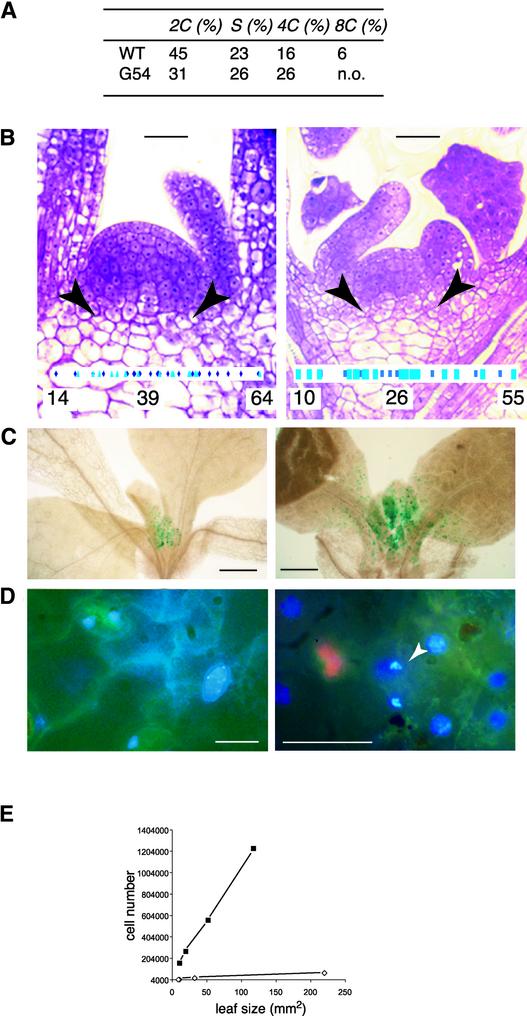
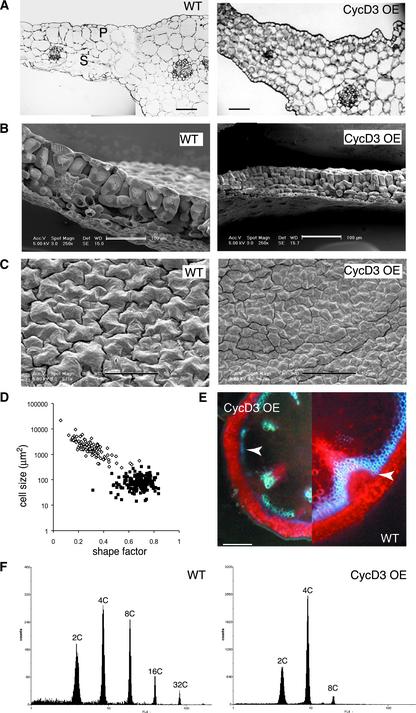
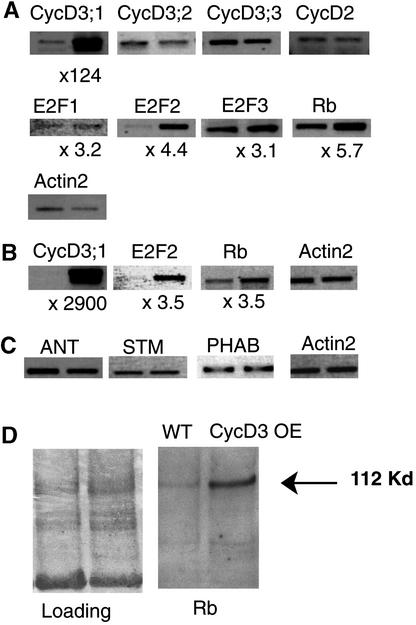
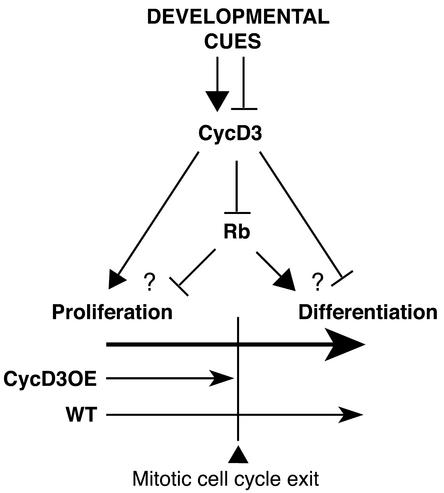
CYCD3;1 expression in Arabidopsis is associated with proliferating tissues such as meristems and developing leaves but not with differentiated tissues. Constitutive overexpression of CYCD3;1 increases CYCD3;1-associated kinase activity and reduces the proportion of cells in the G1-phase of the cell cycle. Moreover, CYCD3;1 overexpression leads to striking alterations in development. Leaf architecture in overexpressing plants is altered radically, with a failure to develop distinct spongy and palisade mesophyll layers. Associated with this, we observe hyperproliferation of leaf cells; in particular, the epidermis consists of large numbers of small, incompletely differentiated polygonal cells. Endoreduplication, a marker for differentiated cells that have exited from the mitotic cell cycle, is inhibited strongly in CYCD3;1-overexpressing plants. Transcript analysis reveals an activation of putative compensatory mechanisms upon CYCD3;1 overexpression or subsequent cell cycle activation. These results demonstrate that cell cycle exit in the G1-phase is required for normal cellular differentiation processes during plant development and suggest a critical role for CYCD3 in the switch from cell proliferation to the final stages of differentiation.


Figures

Figure 1.
Figure 1.
Localization of CYCD3;1 Transcripts in Vegetative and Flowering Arabidopsis Shoot Apices. Autoradiographic signal was visualized by dark-field illumination, and the underlying tissue was stained with Calcofluor and visualized by epifluorescence. CYCD3;1 expression was confined to proliferating tissues such as the meristems, procambium, vascular tissues, and developing leaves. (A) In situ hybridization with CYCD3;1 probe in vegetative shoot apices. Slightly higher CYCD3;1 mRNA levels were detected in the peripheral zone of the shoot apical meristem. (B) Negative control using a sense probe shows that nonspecific staining with silver particles was not detected in young inflorescence meristems. (C) Young inflorescence meristems display a strong signal in the flanks of the meristem, and floral meristems contain high levels of transcripts. (D) At the onset of floral stalk outgrowth, the pith cells adjacent to the meristem contain a stronger signal compared with the more expanded pith cells at the base. (E) In a negative control using the sense probe, nonspecific staining with silver particles was not detected in floral shoot apices. The stronger white background originates from the Calcofluor. (F) Upon further elongation of the floral stalk, the signal in the pith decreases. (G) Axillary meristems contain an increased amount of CYCD3;1 transcripts. AxB, axillary bud; FM, floral meristem; IM, inflorescence meristem; LP, leaf primordia; P, pith; PR, procambium; SAM, shoot apical meristem. Bars = 100 μm.
Figure 2.
Figure 2.
CYCD3;1 Protein Levels and Associated Kinase Activity upon Constitutive CYCD3;1 Overexpression. (A) CYCD3;1 levels in wild-type (lanes 1 to 4) and OE (lanes 5 to 8) leaves (lanes 1 and 5), shoots (lanes 2 and 6), roots (lanes 3 and 7), and flowers (lanes 4 and 8) are shown. Lane c, control (recombinant CYCD3;1 protein). (B) Histone H1 protein kinase activity of anti-CYCD3;1 immunoprecipitates of wild-type (wt) and CYCD3;1 OE leaf extracts.
Figure 3.
Figure 3.
CYCD3;1 Overexpression Causes Leaf Abnormalities and Retarded Development. (A) Six-day-old wild-type (left) and homozygote CYCD3;1 OE (right) seedlings showing enlarged cotyledons of the homozygous CYCD3;1 OE plant. (B) Fourteen-day-old seedlings displayed curled leaves (left, wild-type plant; right, CYCD3;1 OE plant). (C) Twenty-two-day-old plants showing earlier flowering of wild-type (WT) than CYCD3;1 OE plants. (D) One-month-old soil-grown transgenic and wild-type plants showing the reduced inflorescence and flower number of CYCD3;1 OE plants. (E) CYCD3;1 overexpressors initiate leaves at a slower rate and flower later (arrows).
Figure 4.
Figure 4.
Effects of CYCD3;1 Overexpression on Cell Division in Shoot Apices and Leaves. (A) Percentages of cells with a given DNA content in CYCD3;1 OE (G54) and wild-type (WT) shoot apices. n.o., not observed. (B) Longitudinal sections through the shoot apex of CYCD3;1 OE (right) and wild-type (left) seedlings. Cells flanking the meristem (arrowheads) are smaller in CYCD3;1 overexpressors. Sizes of individual cells were measured and are plotted as blue symbols along a size gradient as indicated. Results were collected from two separate meristems and are plotted together as dark and pale blue bars for wild-type (left) and CYCD3;1 OE (right) plants. The extreme and median values are shown below the blue bars in square micrometers. Bars = 25 μm. (C) CYCB-GUS expression was more widespread in shoots of CYCD3;1 OE seedlings (right) compared with wild-type seedlings (left). Bars = 500 μm. (D) 4′,6-Diamidino-2-phenylindole staining of DNA in adaxial epidermal cells of mature cotyledons. Metaphases (arrowhead) and smaller nuclei were detected in CYCD3;1 OE cells (right), whereas the epidermal pavement wild-type cells (left) contained only large nuclei. Bars = 20 μm. (E) Adaxial epidermal cell numbers plotted against leaf sizes of developmentally equivalent rosette leaves of CYCD3;1 OE (squares) and wild-type (diamonds) plants.
Figure 5.
Figure 5.
CYCD3;1 Overexpression Affects Differentiation in Leaves. (A) Cross-sections of wild-type (WT) and transgenic leaves (6 mm long) taken 1 mm from the leaf tip. The typical organization of palisade (P) and spongy (S) mesophyll was not detected in the CYCD3;1 OE leaf. Bars = 100 μm. (B) Scanning electron micrographs of cross-sections through mature rosette leaves showing the presence of nonelongated palisade and spongy mesophyll cells in older leaves of the CYCD3;1 OE plant. Bars = 100 μm. (C) Scanning electron micrographs of the adaxial epidermis shows sinusoid-shaped pavement cells in wild-type cells and smaller polygon-shaped cells in CYCD3;1 OE cells. Bars = 50 μm. (D) Areas of adaxial epidermal cells of the leaf were plotted against the shape factor (4Π area/perimeter2), representing combined data from 120 cell areas measured in leaves of three sizes (∼10 mm2, 30 to 50 mm2, and fully mature). An increase in cell area is accompanied by a more complex shape (lower shape factor) in wild-type plants (diamonds). Epidermal cells in CYCD3;1 OE plants (squares) have a less complex shape (shape factor closer to 1) and smaller areas. (E) Cross-sections of the bases of mature inflorescence stalks. The formation of xylem elements is retarded in the CYCD3;1 OE plant. Both images show a section at the same magnification. Arrowheads indicate xylem elements. Bar = 200 μm. (F) Histograms of the DNA distribution in the fifth rosette leaves of wild-type and CYCD3;1 OE plants.
Figure 6.
Figure 6.
Expression Analysis of G1/S Genes and Patterning Genes by Semiquantitative RT-PCR. The left lane represents the wild-type signal, and the right lane represents the CYCD3;1 OE signal; separate actin controls apply to each section of the figure. Results of relative quantification by real-time PCR using ACTIN2 as a reference gene are indicated below each gel image. Expression analysis of G1/S genes is shown for young seedlings (A) and mature rosette leaves (B). (A) Of the CYCD genes tested, only the transcript level of CYCD3;1 was upregulated strongly in CYCD3;1 OE seedlings. This effect coincided with a strong increase of transcription of the Rb gene and increases in E2F gene transcripts in the transgenic plant. (B) Transcripts of CYCD3;1 were almost undetectable in mature wild-type leaves (left lane) but remained abundant in CYCD3;1 OE leaves (right lane). Again, E2F2 and Rb expression was stronger in the CYCD3;1 OE leaves. (C) ANT, SHOOTMERISTEMLESS (STM), and PHABULOSA (PHAB) mRNA levels were unchanged in the CYCD3;1 OE plants. (D) Protein gel blot analysis of Rb levels. Levels of Rb protein were higher in extracts of CYCD3;1 OE cells (right panel, right lane) compared with wild-type (WT) cells (right panel, left lane). A Ponceau stain of the membrane is presented as a loading control (left panel).
Figure 7.
Figure 7.
Model Illustrating CYCD3 Action on the Transition from Proliferation to Differentiation in Cells. Developmental cues influence CYCD3 transcription. CYCD3/CDK complexes inactivate Rb by hyperphosphorylation, promoting cell proliferation and preventing cell cycle exit and subsequent differentiation. Therefore, some CYCD3;1 OE cells do not proceed beyond mitotic cell cycle exit and cannot undertake later differentiation events, as do their wild-type (WT) counterparts (bottom). A direct action of CYCD3 in promoting proliferation and/or inhibiting differentiation is not excluded.

References

    1. Barton, M.K., and Poethig, R.S. (1993). Formation of the shoot apical meristem in Arabidopsis thaliana: An analysis of development in the wild type and in the shoot meristemless mutant. Development 119, 823–831.
    1. Besnard-Wibaut, C. (1977). Histoautoradiographic analysis of the thermoinductive processes in the shoot apex of Arabidopsis thaliana L. Heynh, vernalised at different stages of development. Plant Cell Physiol. 18, 949–962.
    1. Bowman, J. (1993). Vegetative development. In Arabidopsis: An Atlas of Morphology and Development, J. Bowman, ed (New York: Springer-Verlag), pp.1–89.
    1. Cockcroft, C.E., den Boer, B.G., Healy, J.M., and Murray, J.A. (2000). Cyclin D control of growth rate in plants. Nature 405, 575–579. - PubMed
    1. Colon-Carmona, A., You, R., Haimovitch-Gal, T., and Doerner, P. (1999). Spatio-temporal analysis of mitotic activity with a labile cyclin-GUS fusion protein. Plant J. 20, 503–508. - PubMed

Publication types

MeSH terms

LinkOut - more resources