. 2003 Jan;15(1):93-106.
doi: 10.1105/tpc.005165.

Tandemly duplicated Arabidopsis genes that encode polygalacturonase-inhibiting proteins are regulated coordinately by different signal transduction pathways in response to fungal infection

Affiliations

Tandemly duplicated Arabidopsis genes that encode polygalacturonase-inhibiting proteins are regulated coordinately by different signal transduction pathways in response to fungal infection

Simone Ferrari et al. Plant Cell. 2003 Jan.

Abstract

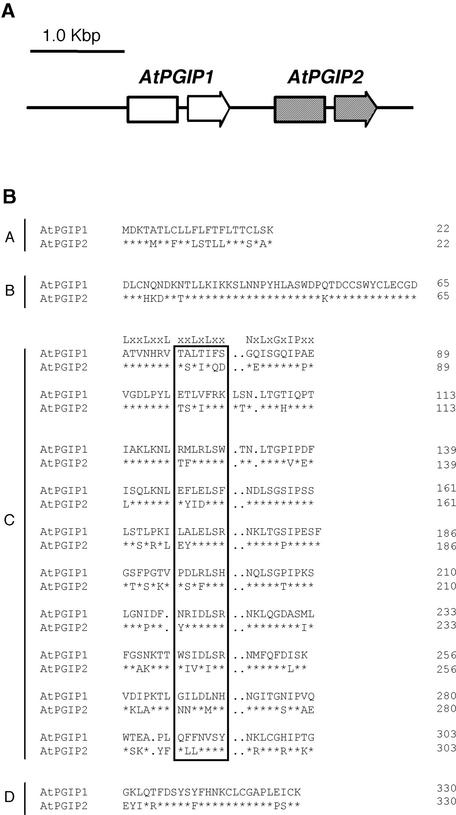
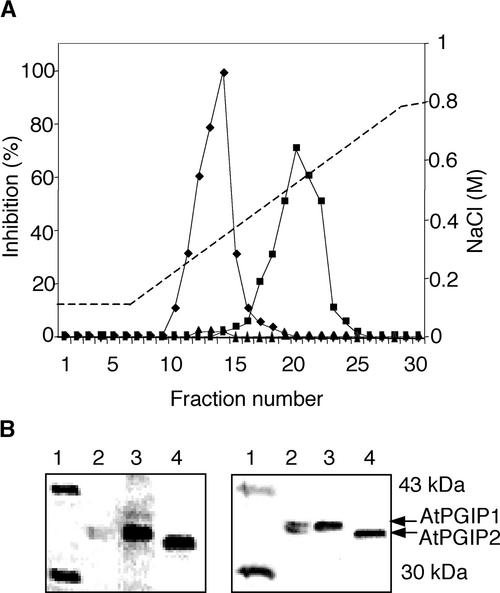
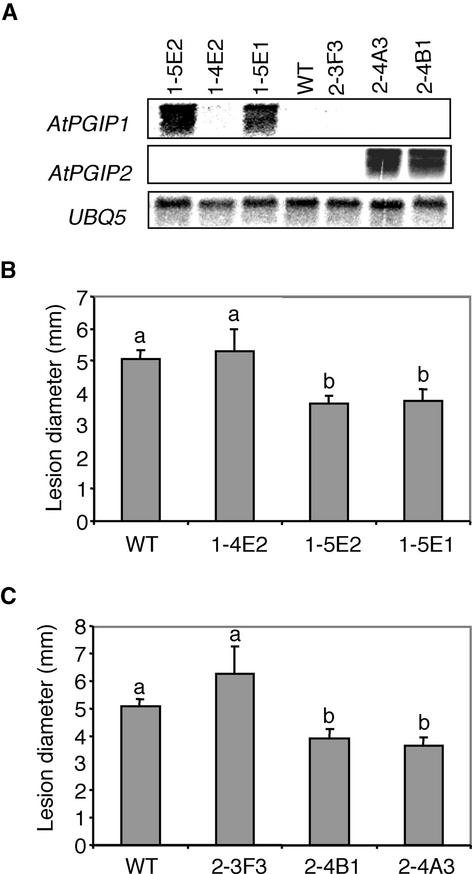
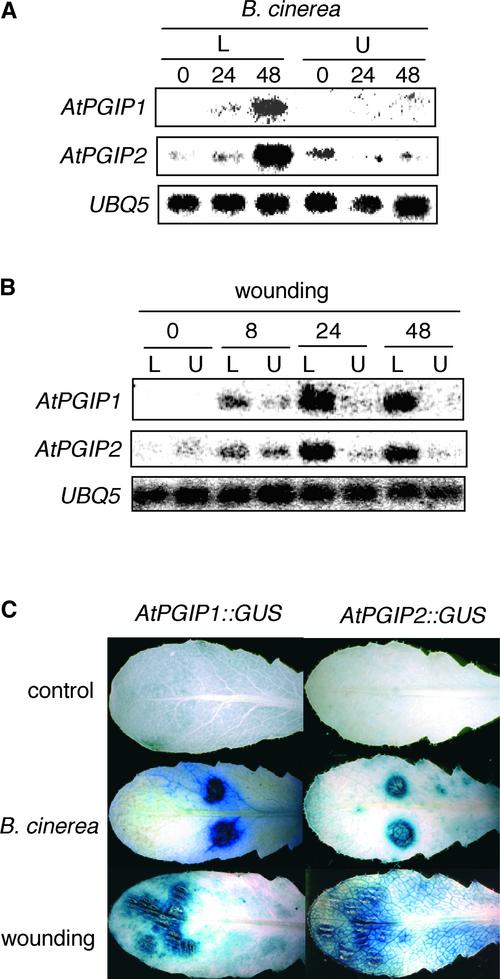
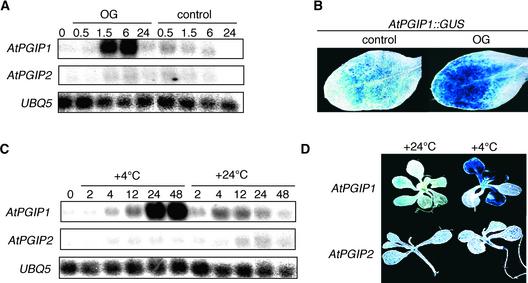
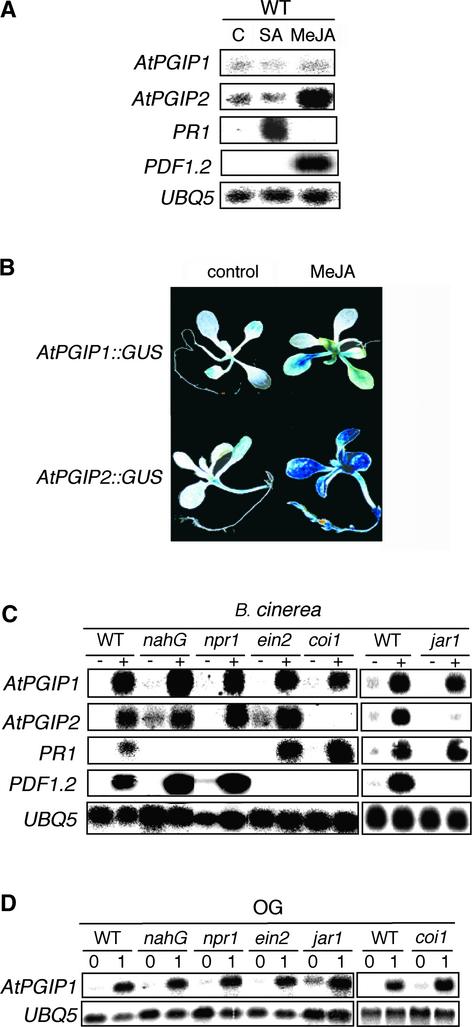
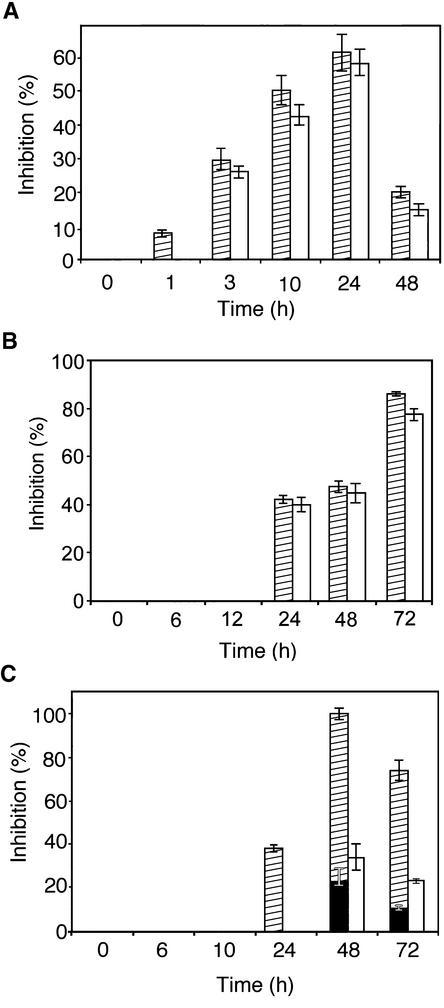
Polygalacturonase-inhibiting proteins (PGIPs) are plant proteins that counteract fungal polygalacturonases, which are important virulence factors. Like many other plant defense proteins, PGIPs are encoded by gene families, but the roles of individual genes in these families are poorly understood. Here, we show that in Arabidopsis, two tandemly duplicated PGIP genes are upregulated coordinately in response to Botrytis cinerea infection, but through separate signal transduction pathways. AtPGIP2 expression is mediated by jasmonate and requires COI1 and JAR1, whereas AtPGIP1 expression is upregulated strongly by oligogalacturonides but is unaffected by salicylic acid, jasmonate, or ethylene. Both AtPGIP1 and AtPGIP2 encode functional inhibitors of polygalacturonase from Botrytis, and their overexpression in Arabidopsis significantly reduces Botrytis disease symptoms. Therefore, gene duplication followed by the divergence of promoter regions may result in different modes of regulation of similar defensive proteins, thereby enhancing the likelihood of defense gene activation during pathogen infection.


Figures

Figure 1.
Figure 1.
Genomic Organization of AtPGIP1 and AtPGIP2 and Comparison of the Predicted Amino Acid Sequences. (A) Genomic organization of AtPGIP1 and AtPGIP2. Arrows represent AtPGIP1 and AtPGIP2 open reading frames, each interrupted by an intron. (B) Sequence alignment of AtPGIP1 and AtPGIP2. The predicted amino acid sequences were aligned using the CLUSTAL W method (Higgins and Sharp, 1988). Typical PGIP domains are indicated (A, signal peptide; B, presumed N terminus of the mature protein; C, 10 LRR modules; D, C terminus). The consensus sequence for extracytoplasmic LRR is indicated above the first LRR module. Residues in the boxed region are predicted to form a β-sheet/β-turn motif (xxLxLxx). Asterisks indicate invariant amino acids in AtPGIP1 and AtPGIP2. Dots represent gaps inserted in the sequences for the optimal alignment of LRR modules.
Figure 2.
Figure 2.
Purification of AtPGIP1 and AtPGIP2. (A) Inhibitory activity of purified AtPGIP1 and AtPGIP2. Desalted total protein extracts from 1-5E1 (squares) and 2-4A3 (diamonds) plants, overexpressing AtPGIP1 and AtPGIP2, respectively, and from untransformed plants (triangles) were subjected to chromatography on a cation-exchange column (SP-Sepharose). Inhibitory activity of the collected fractions was tested against PG of Botrytis. (B) SDS-PAGE of AtPGIPs purified from overexpressing transgenic plants (left) and immunodetection using a polyclonal antibody against bean PGIP (right). Lanes 1, molecular mass markers; lanes 2, PGIP purified from bean pods; lanes 3, AtPGIP1; lanes 4, AtPGIP2. The sizes of the marker bands shown in lanes 1 are indicated at right.
Figure 3.
Figure 3.
Reduction of Botrytis Symptoms in Arabidopsis Plants Overexpressing AtPGIP1 or AtPGIP2. (A) RNA gel blot of independent lines transformed with either 35S::AtPGIP1 (1-4E2, 1-5E1, and 1-5E2) or 35S::AtPGIP2 (2-3F3, 2-4A3, and 2-4B1). WT, untransformed wild-type plants (Col-0). (B) and (C) Botrytis symptoms in 35S::AtPGIP1 (B) and 35S:: AtPGIP2 (C) transgenic plants. Detached leaves from wild-type (WT) or T2 lines transformed with 35S::AtPGIP1 (1-4E2, 1-5E1, and 1-5E2) or 35S::AtPGIP2 (2-3F3, 2-4A3, and 2-4B1) were inoculated with Botrytis. The diameter of the necrotic lesions was measured 3 days after infection. The experiment was repeated twice with similar results. Bars represent the average of at least 30 samples ± se. Different letters indicate data sets significantly different according to Tukey's Student range test (P > 0.95).
Figure 4.
Figure 4.
Induction of AtPGIP1 and AtPGIP2 in Response to Botrytis Infection and Wounding. (A) and (B) RNA gel blot of wild-type leaves inoculated with Botrytis (A) or mechanically wounded (B) and harvested at the indicated times (in hours). L, treated leaves; U, upper, untreated leaves. (C) Leaves from transgenic AtPGIP1::GUS and AtPGIP2::GUS plants harvested at 48 h after inoculation with sterile medium (top leaves) or Botrytis (middle leaves) or at 24 h after wounding (bottom leaves) and stained for GUS activity. A representative sample is shown for each treatment.
Figure 5.
Figure 5.
Induction of AtPGIP1 in Response to OGs and Low Temperature. (A) RNA gel blot of seedlings incubated in the presence of 100 μg/mL OGs or in sterile medium (control) and harvested at the indicated times (in hours). (B) AtPGIP1::GUS seedlings were treated as in (A) and stained for GUS activity after 6 h of treatment. The image shows the first leaf of a representative seedling treated with sterile medium (control) or OGs. (C) RNA gel blot of Arabidopsis seedlings incubated at 4 or 24°C and harvested at the indicated times (in hours). (D) AtPGIP1::GUS and AtPGIP2::GUS seedlings were incubated at 4 or 24°C for 48 h and stained for GUS activity. The image shows a representative seedling for each treatment.
Figure 6.
Figure 6.
Effect of Disease-Related Signals on AtPGIP1 and AtPGIP2 Expression. (A) RNA gel blot of leaves harvested at 48 h after treatment with 5 mM SA, 100 μM MeJA, or control solution (C). WT, wild type. (B) AtPGIP1::GUS and AtPGIP2::GUS seedlings were incubated for 48 h in the presence of 50 μM MeJA or in control medium and stained for GUS activity. The image shows a representative seedling for each treatment. (C) RNA gel blot of wild-type, nahG, npr1, ein2, coi1, and jar1 leaves inoculated with Botrytis (+) or with sterile medium (−) and harvested after 48 h. (D) RNA gel blot of wild-type, nahG, npr1, ein2, jar1, and coi1 seedlings treated with 100 μg/mL OG and harvested at the indicated times (in hours).
Figure 7.
Figure 7.
Accumulation of PGIP Activity in Response to OGs, Cold, and MeJA. Inhibition of Botrytis (striped bars) and C. gloeosporioides (open bars) endo-PGs by protein extracts from seedlings treated with OGs (A), low temperature (B), or MeJA (C). (A) Seedlings were treated with OGs (100 μg/mL) and harvested at the indicated times. Bars represent the average inhibition of PG activity ± sd of three independent experiments, using 8 μg of total protein. The comparable ability to inhibit these two enzymes indicates that the induced PGIP is represented mainly by AtPGIP1. No inhibitory activity was detected in untreated control plants. (B) Seedlings were incubated at 4°C and harvested at the indicated times. Bars represent the average inhibition of PG activity ± sd of three independent experiments, using 3 μg of total protein. The comparable ability to inhibit these two enzymes indicates that the induced PGIP is represented mainly by AtPGIP1. No inhibitory activity was detected in untreated control plants. (C) Seedlings were treated with 50 μM MeJA and harvested at the indicated times. Bars represent the average inhibition of PG activity ± sd of three independent experiments, using 3 μg of total protein. Superimposed black bars indicate the activity against Botrytis PG detected in control plants. The lower inhibition of C. gloeosporioides PG indicates that the induced PGIP is represented mainly by AtPGIP2.

Similar articles

Cited by

References

    1. Altschul, S.F., Gish, W., Miller, W., Myers, E.W., and Lipman, D.J. (1990). Basic local alignment search tool. J. Mol. Biol. 215, 403–410. - PubMed
    1. Arabidopsis Genome Initiative. (2000). Analysis of the genome sequence of the flowering plant Arabidopsis thaliana. Nature 408, 796–815. - PubMed
    1. Armand, S., Wagemaker, M.J., Sanchez-Torres, P., Kester H.C., van Santen, Y., Dijkstra, B.W., Visser, J., and Benen, J.A. (2000). The active site topology of Aspergillus niger endopolygalacturonase II as studied by site-directed mutagenesis. J. Biol. Chem. 275, 691–696. - PubMed
    1. Ausubel, F.M., Brent, R., Kingston, R.E., Moore, D.D., Seidman, J.G., Smith, J.A., and Struhl, K. (2002). Current Protocols in Molecular Biology. (New York: Greene Publishing Associates).
    1. Baker, S.S., Wilhelm, K.S., and Thomashow, M.F. (1994). The 5′-region of Arabidopsis thaliana cor15a has cis-acting elements that confer cold-, drought- and ABA-regulated gene expression. Plant Mol. Biol. 24, 701–713. - PubMed

Publication types

MeSH terms