. 2003 Jan 1;23(1):73-83.
doi: 10.1523/JNEUROSCI.23-01-00073.2003.

Opposite action of beta1- and beta2-adrenergic receptors on Ca(V)1 L-channel current in rat adrenal chromaffin cells

Affiliations

Opposite action of beta1- and beta2-adrenergic receptors on Ca(V)1 L-channel current in rat adrenal chromaffin cells

T Cesetti et al. J Neurosci. .

Abstract

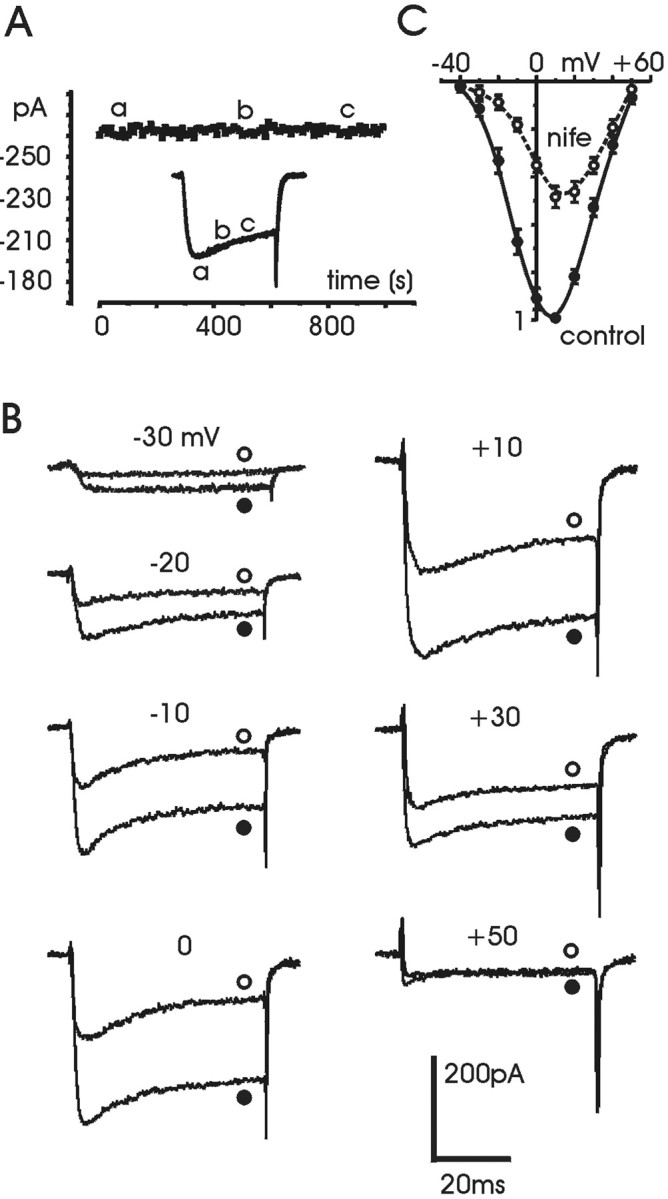
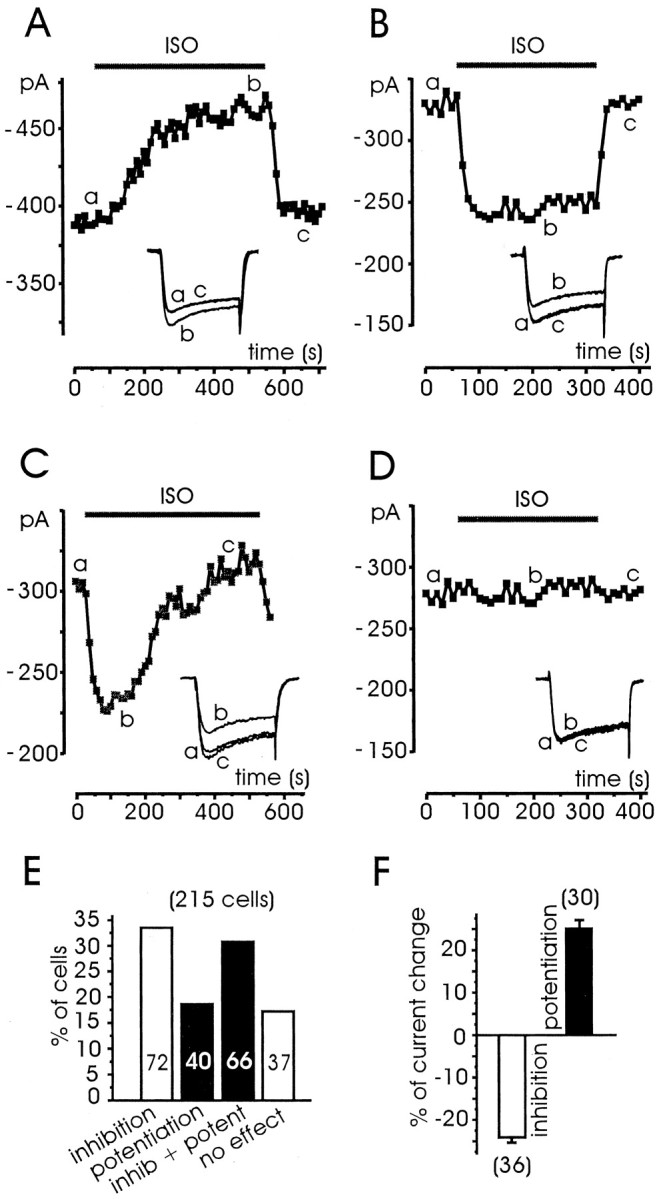
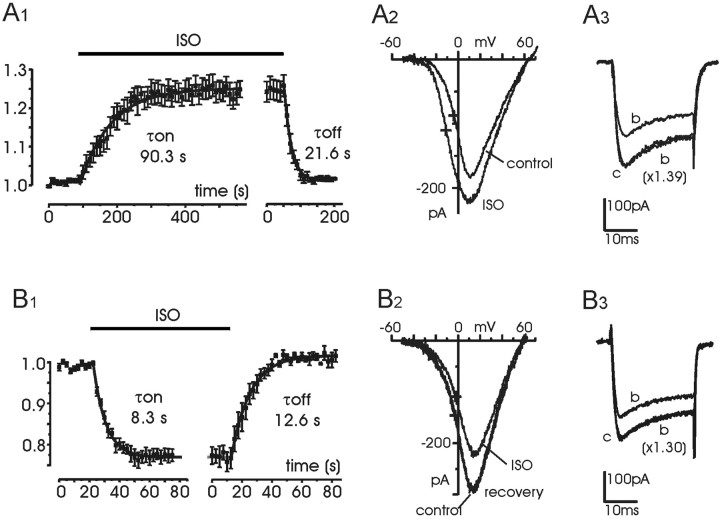
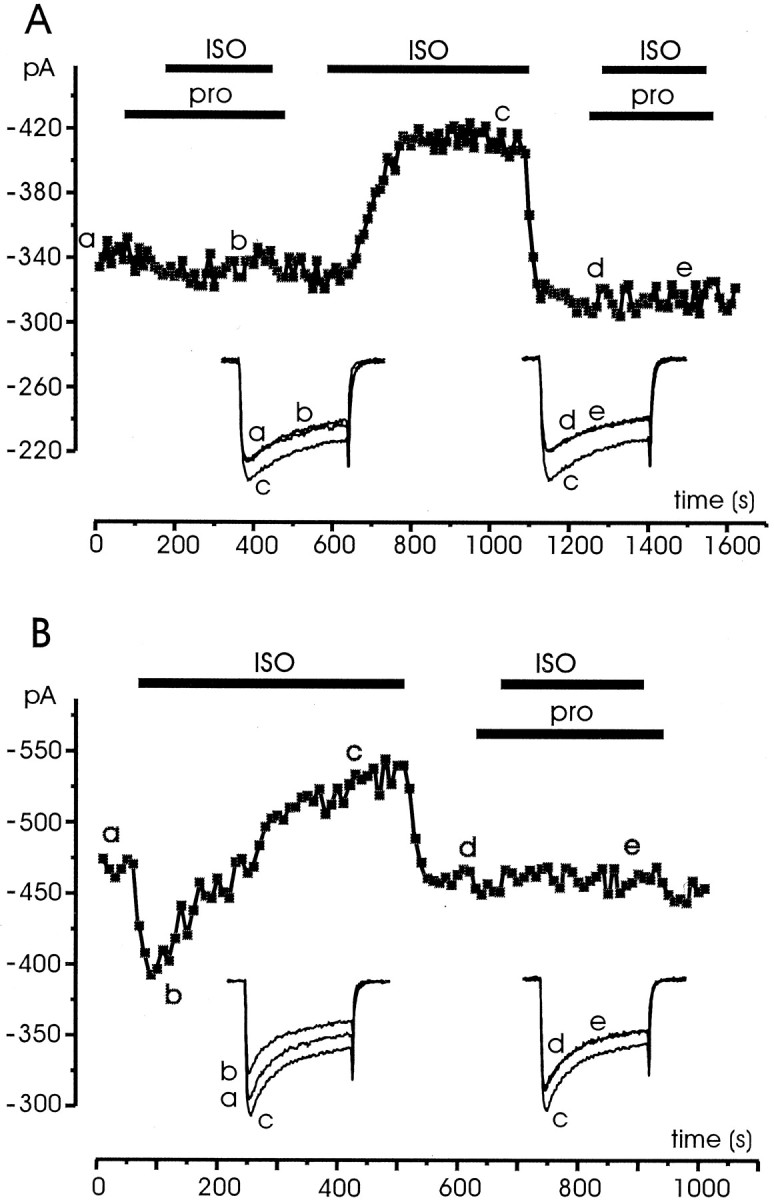
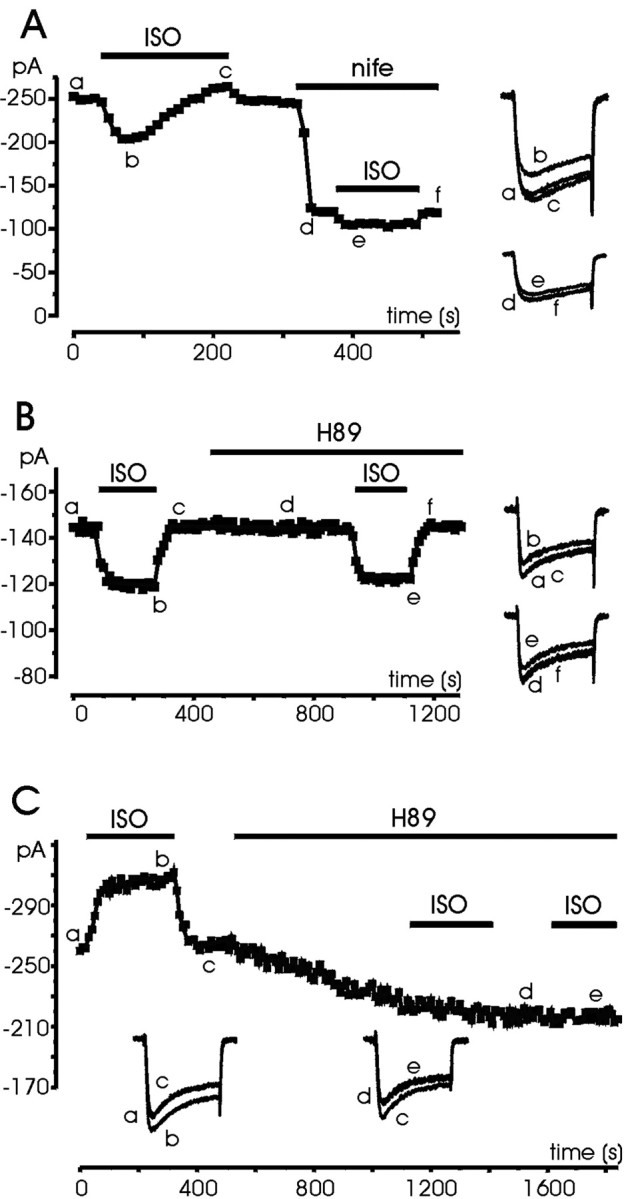
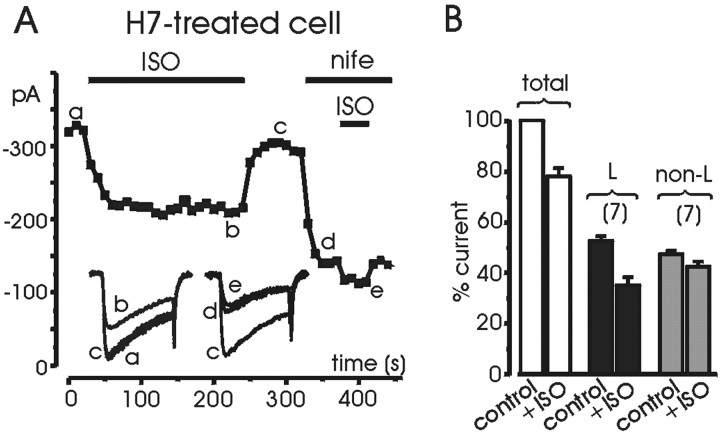
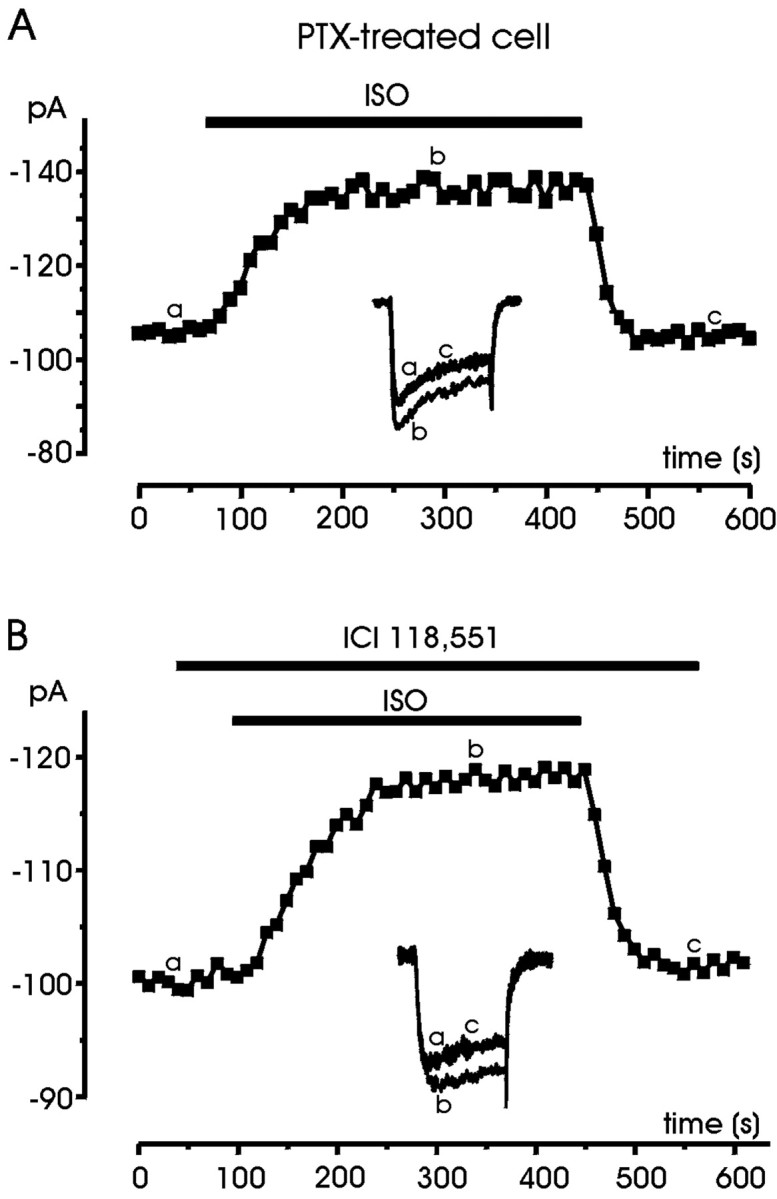
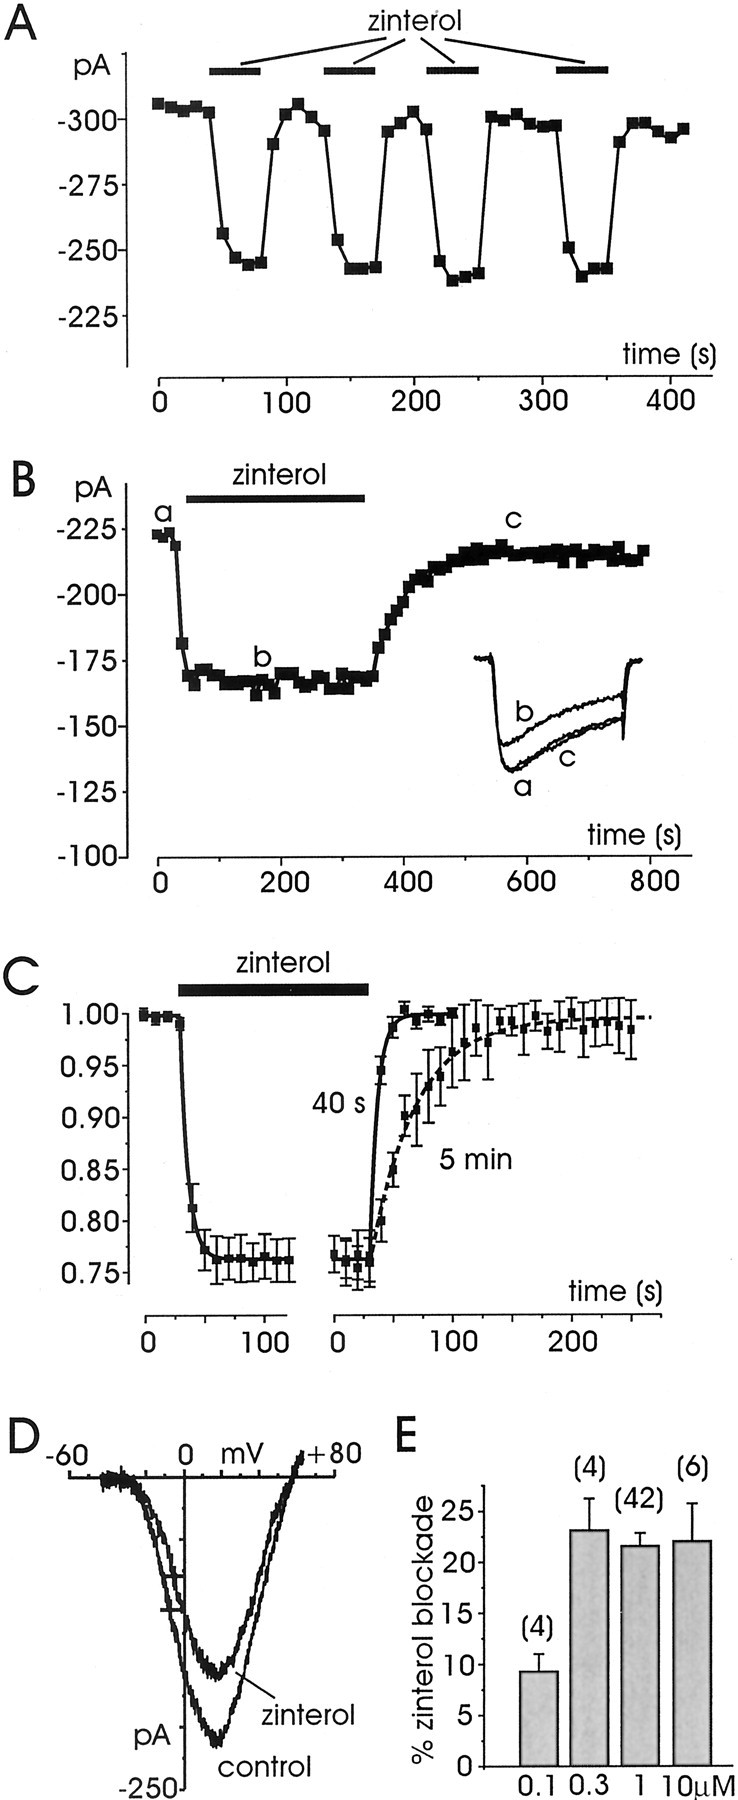
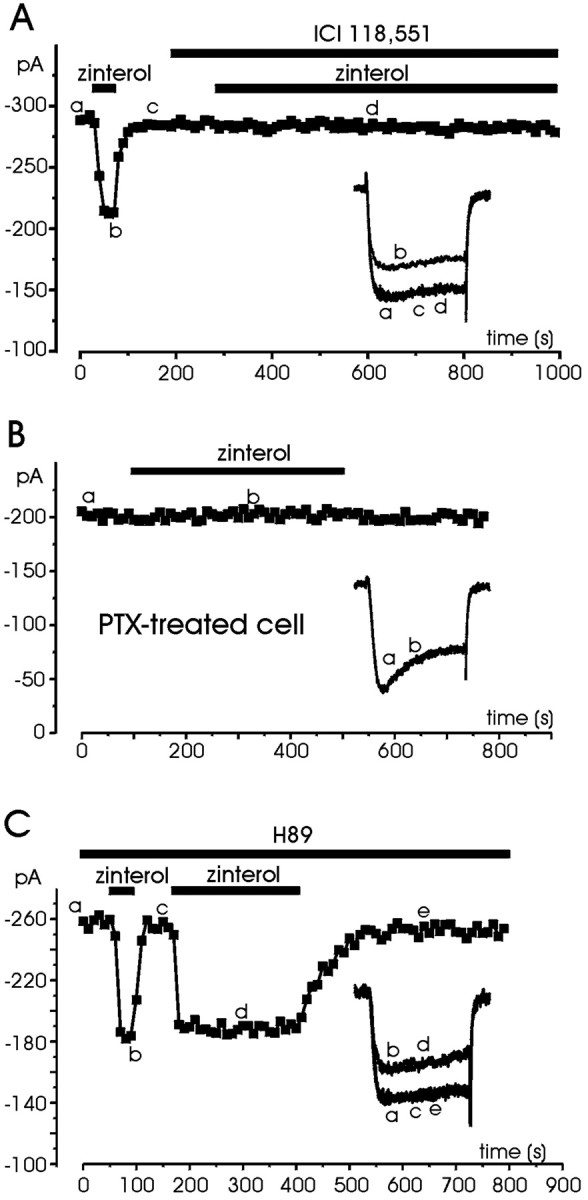
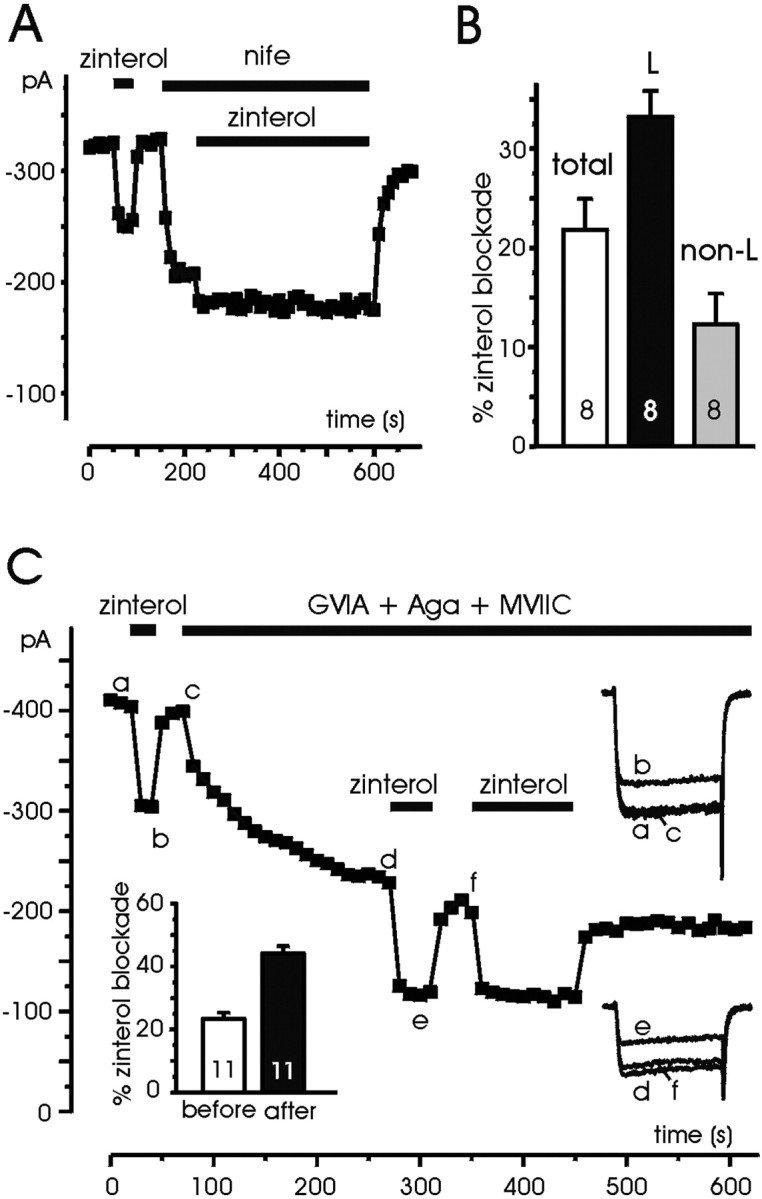
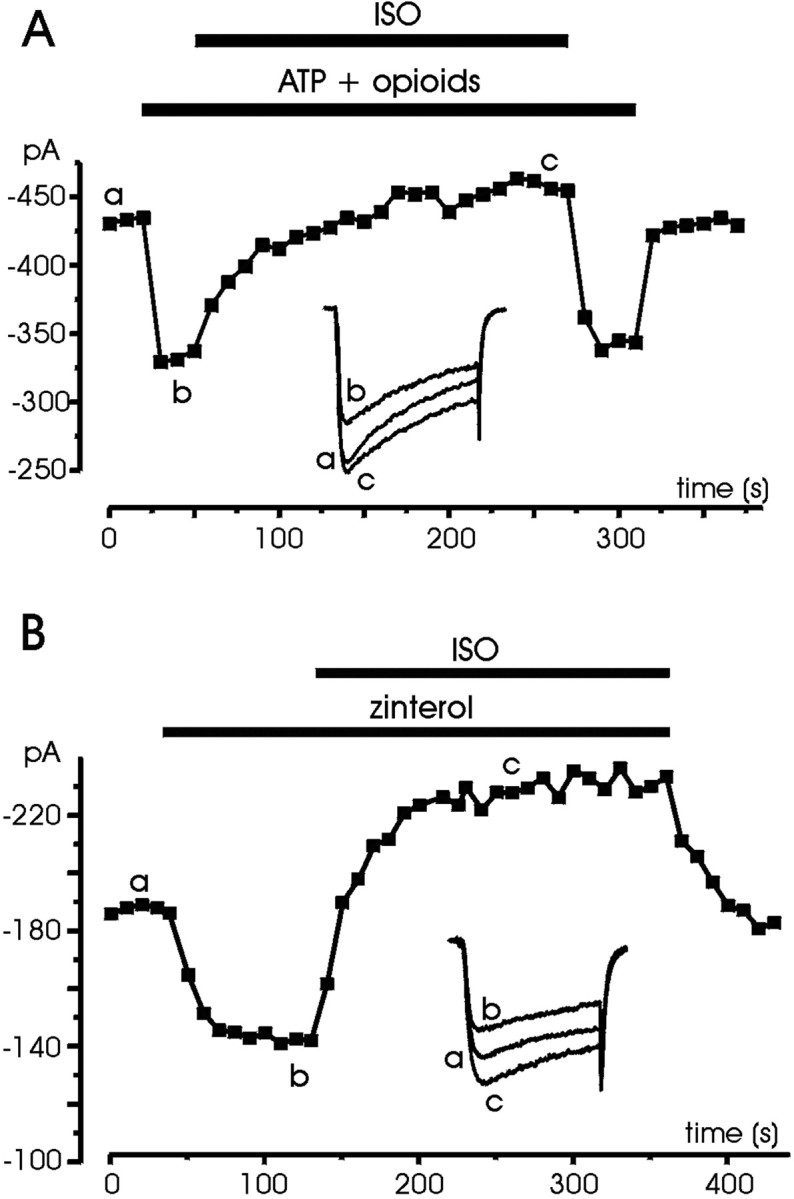
Voltage-gated Ca(2+) channels of chromaffin cells are modulated by locally released neurotransmitters through autoreceptor-activated G-proteins. Clear evidence exists in favor of a Ca(2+) channel gating inhibition mediated by purinergic, opioidergic, and alpha-adrenergic autoreceptors. Few and contradictory data suggest also a role of beta-adrenergic autoreceptors (beta-ARs), the action of which, however, remains obscure. Here, using patch-perforated recordings, we show that rat chromaffin cells respond to the beta-AR agonist isoprenaline (ISO) by either upmodulating or downmodulating the amplitude of Ca(2+) currents through two distinct modulatory pathways. ISO (1 microm) could cause either fast inhibition (approximately 25%) or slow potentiation (approximately 25%), or a combination of the two actions. Both effects were completely prevented by propranolol. Slow potentiation was more evident in cells pretreated with pertussis toxin (PTX) or when beta(1)-ARs were selectively stimulated with ISO + ICI118,551. Potentiation was absent when the beta(2)-AR-selective agonist zinterol (1 microm), the protein kinase A (PKA) inhibitor H89, or nifedipine was applied, suggesting that potentiation is associated with a PKA-mediated phosphorylation of L-channels (approximately 40% L-current increase) through beta(1)-ARs. The ISO-induced inhibition was fast and reversible, preserved in cell treated with H89, and mimicked by zinterol. The action of zinterol was mostly on L-channels (38% inhibition). Zinterol action preserved the channel activation kinetics, the voltage-dependence of the I-V characteristic, and was removed by PTX, suggesting that beta(2)AR-mediated channel inhibition was mainly voltage independent and coupled to G(i)/G(o)-proteins. Sequential application of zinterol and ISO mimicked the dual action (inhibition/potentiation) of ISO alone. The two kinetically and pharmacologically distinct beta-ARs signaling uncover alternative pathways, which may serve the autocrine control of Ca(2+)-dependent exocytosis and other related functions of rat chromaffin cells.


Figures

Fig. 1.
Fig. 1.
Ca2+ current of RCCs in perforated-patch recording conditions. A, Time course of Ca2+ current amplitude recorded in perforated-patch conditions from an RCC superfused with control external solution. Eachsymbol represents the peak amplitude of Ca2+ current evoked by depolarizing the cell every 10 sec to +10 mV for 25 msec from a holding potential (Vh) of −40 mV. Return potential (Vr) was equal to holding potential. The three current traces shown in the inset were recorded at the time indicated by the correspondingletters in the graph. B, Ca2+ currents recorded before (●) and during (○) application of 3 μm nifedipine at the potentials indicated. Holding potential and return potential are as inA. C, Normalized meanIV characteristics calculated at the end of the 50 msec pulse from seven cells, before (●) and during (○) application of nifedipine. Notice the slight shift to the right of the IV curve with nifedipine caused by the block of L-channels.
Fig. 2.
Fig. 2.
Differential effects of ISO on Ca2+ currents of RCCs. Examples of potentiation (A), inhibition (B), inhibition + potentiation (C), and no action (D) on Ca2+ currents induced by 1 μm ISO on different RCCs. Each cell was initially superfused with control external solution and successively exposed to ISO for the period indicated by the bar. Thesymbols represent peak current amplitudes measured on step depolarization to +10 mV for 25 msec and repeated every 10 sec.Vh and Vr, −40 mV. In the insets are shown the original recordings taken at the time indicated by the letters.E, Percentage of cells exhibiting potentiation, inhibition, inhibition + potentiation, or no action, derived from a total of 215 cells. F, Mean percentage of Ca2+ current inhibition (open bar) and potentiation (filled bar) observed in isolation. Cells were selected among those behaving like the examples illustrated in A and B, with complete recovery after ISO exposure.
Fig. 3.
Fig. 3.
Onset, offset, and voltage dependence of ISO-induced potentiation and inhibition.A1, Onset and offset of ISO-induced potentiation calculated by averaging the Ca2+current increment in eight cells exposed to 1 μmISO. Control currents before ISO were scaled and normalized to their maximum. The solid curves are the result of least-squares fit with single exponential functions with time constants τon = 90.3 sec and τoff = 21.6 sec. A2,IV curves before and during an ISO-induced potentiation. The crosses indicate the voltage at which the IV curve reached half its maximal amplitude (V1/2): −4.1 mV (control) and −11.3 mV (ISO). A3, Recordings taken from Figure 2C. Trace b was scaled by a factor of 1.39 to overlap trace c. B1, Onset and offset of ISO-induced inhibition calculated by averaging the current depression of 10 cells, using the same procedure as A1. The fit with single exponentials gave τon = 8.3 sec and τoff = 12.6 sec.B2, IVcurves before and during an ISO-induced inhibition.V1/2 was −2.2 mV (control) and −2.9 mV (ISO), indicated by the crosses. B3, Current recordings derived from Figure 2B. Trace b was scaled by a factor of 1.30 to overlap trace c.
Fig. 4.
Fig. 4.
Propranolol prevents the effects of ISO stimulation regardless of type of response. A, The cell was initially superfused with control external solution and successively exposed to solutions containing propranolol (1 μm) and ISO (1 μm) for the periods indicated by the bars. B, Same recording conditions as in A except that the cell responded to ISO stimulation with a fast inhibition followed by a slow potentiation, both prevented by propranolol. Symbols,lettering, and traces have the same meaning as in previous figures.
Fig. 5.
Fig. 5.
Nifedipine and H89 selectively prevent the Ca2+ current potentiation induced by ISO.A, The cell was first superfused with 1 μmISO in control external solution and then exposed to a solution containing 3 μm nifedipine and ISO for the periods indicated. Notice that after DHP application the cell responded with a weak inhibition and no potentiation. B, The cell was first tested for the effect of ISO, which was inhibitory. Subsequently the cell was superfused with a solution containing H89 (5 μm) and retested for the inhibitory effect of ISO.C, The cell first responded to ISO with a clear potentiation. Subsequent exposure to H89 (5 μm) reduced the Ca2+ current amplitude and removed the effects of ISO. Symbols, lettering, andtraces have the same meaning as in previous figures.
Fig. 6.
Fig. 6.
Percentage inhibition of L- and non-L channels in cells pretreated with H7. A, The H7-treated cell was first tested for the inhibitory effect of ISO and subsequently exposed to nifedipine (3 μm) and ISO (1 μm) for the periods indicated. The percentage inhibition of L-channels was estimated by subtracting the inhibition of the total current from that of non-L-currents properly weighted for the contribution to the total current. Symbols, lettering, and traces have the same meaning as in previous figures. B, Mean percentage inhibition induced by ISO on L-currents, non L-currents, and total currents obtained from six cells pretreated with H7.
Fig. 7.
Fig. 7.
PTX treatment and ICI 118,551 remove the inhibitory action of ISO. A, The PTX-treated cell was first superfused with control external solution and then exposed to 1 μm ISO for the period indicated. B, The cell was first superfused with control external solution and then exposed to the β2-AR-selective antagonist ICI 118,551 (0.1 μm) and ISO (1 μm) for the periods indicated. Symbols, lettering, andtraces have the same meaning as in previous figures.
Fig. 8.
Fig. 8.
Zinterol induces only Ca2+current inhibitions. A, The cell was first superfused with control external solution and then exposed to four brief applications (40 sec) of the β2-AR-selective agonist zinterol (1 μm). Zinterol produced repeated reversible inhibitions of Ca2+ currents with rapid onset and offset. B, Longer applications of zinterol (5 min) produced the same degree of inhibition but slower offset. ForA and B, symbols,lettering, and traces have the same meaning as that in previous figures. C, Onset and offset of zinterol-induced inhibition calculated by averaging the Ca2+ current depression in cells sequentially exposed for 40 sec or 5 min to 1 μm zinterol. Control currents before zinterol were scaled and normalized to their maximum. The solid curves are the result of a fit with single exponential functions with time constantsτon = 6.5 sec (n = 10) and τoff= 6.6 sec (after 40 sec; n = 7) andτoff = 38.1 sec (after 5 min;n = 7). τoff values were calculated from cells on which zinterol was sequentially applied for short and long periods. D,IV curves recorded before and during application of zinterol (1 μm). Voltages of half-maximal activation indicated by the crosses(V1/2) were −7.4 mV (control) and −5.3 mV (zinterol). E, Percentage of inhibition at different zinterol concentrations, showing that above 300 nm the percentage of inhibition is saturating.
Fig. 9.
Fig. 9.
Pharmacology of zinterol action. A, The cell was tested for the effect of zinterol (1 μm) before and during exposure to the β2-AR-selective antagonist ICI 118,551. The antagonists could prevent the zinterol-induced inhibition. B, The PTX-treated cell was superfused with control external solution and tested for the action of zinterol (1 μm) during the period indicated. In eight cells pretreated with PTX, zinterol had practically no action.C, The cell was initially superfused with a solution containing H89 (5 μm) and then exposed to zinterol (1 μm) for the periods indicated. H89 was unable to prevent the inhibitory effects of zinterol. Symbols,lettering, and traces have the same meaning as that in previous figures.
Fig. 10.
Fig. 10.
Zinterol has a preferential action on L-channels.A, The cell was superfused with control external solution and then exposed to zinterol (1 μm) before and during nifedipine application (3 μm) for the periods indicated. Notice the small action of zinterol on non-L-currents.B, Percentage of zinterol inhibition on L- and non-L-currents estimated from the blocking action of nifedipine (3 μm) on eight cells as illustrated in A.C, The cell was superfused with control external solution and then exposed to zinterol (1 μm) before and during addition of ω-CTx-GVIA (1 μm), ω-Aga-IVA (200 nm), and ω-CTx-MVIIC (2 μm) for the periods indicated. The action of zinterol is minimally affected by the toxins, suggesting that most of the effects of the β2-AR agonist are on toxin-resistant currents, which are carried mainly by L-channels. Symbols, lettering, andtraces have the same meaning as in previous figures.
Fig. 11.
Fig. 11.
ISO produces only potentiation after the inhibitory effects induced by purinergic, opioidergic, and β2-adrenergic receptors. A, The cell was initially superfused with control external solution and then exposed to ATP (100 μm), DPDPE (1 μm), and DAMGO (10 μm), which caused inhibition. Addition of ISO (1 μm) caused no further depression but only a slow current potentiation. B, Sequential application of zinterol (1 μm) and ISO (1 μm) mimics the dual action of ISO shown in Figures 2C and 4B, proving that inhibition is mediated by β2-ARs, whereas potentiation by ISO proceeds through β1-ARs.Symbols, lettering, andtraces have the same meaning as in previous figures.

References

    1. Albillos A, Gandía L, Michelena P, Gilabert JA, del Valle M, Carbone E, García AG. The mechanism of calcium channel facilitation in bovine chromaffin cells. J Physiol (Lond) 1996a;494:687–695. - PMC - PubMed
    1. Albillos A, Carbone E, Gandía L, García AG, Pollo A. Opioid inhibition of Ca2+ channel subtypes in bovine chromaffin cells: selectivity of action and voltage-dependence. Eur J Neurosci. 1996b;8:1561–1570. - PubMed
    1. Artalejo CR, Ariano MA, Perlman RA, Fox AP. Activation of facilitation calcium channels in chromaffin cells by D1 dopamine receptors through a cAMP/protein kinase A-dependent mechanism. Nature. 1990;348:239–242. - PubMed
    1. Barry PH, Lynch JW. Liquid junction potentials and small cell effects in patch-clamp analysis. J Membr Biol. 1991;121:101–117. - PubMed
    1. Bean BP, Nowycky MC, Tsien RW. β-Adrenergic modulation of calcium channels in frog ventricular heart cells. Nature. 1984;307:371–375. - PubMed

Publication types

MeSH terms

LinkOut - more resources