. 2003 Jan 1;23(1):103-11.
doi: 10.1523/JNEUROSCI.23-01-00103.2003.

Local and global spontaneous calcium events regulate neurite outgrowth and onset of GABAergic phenotype during neural precursor differentiation

Affiliations

Local and global spontaneous calcium events regulate neurite outgrowth and onset of GABAergic phenotype during neural precursor differentiation

Francesca Ciccolini et al. J Neurosci. .

Abstract

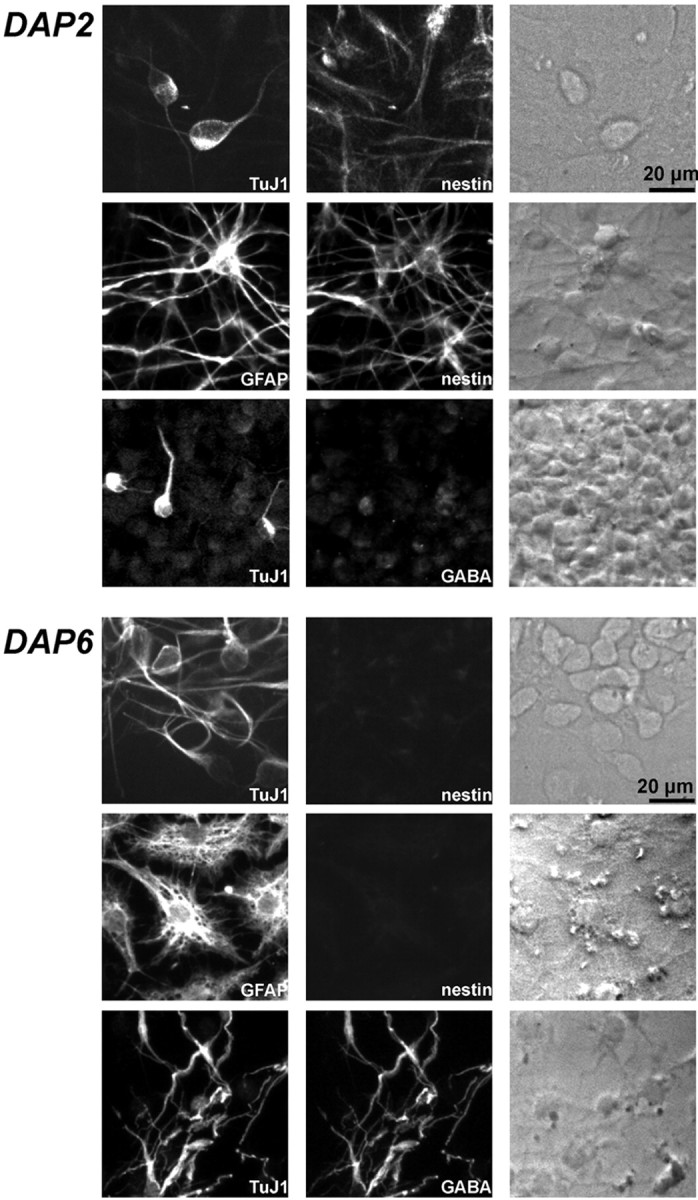
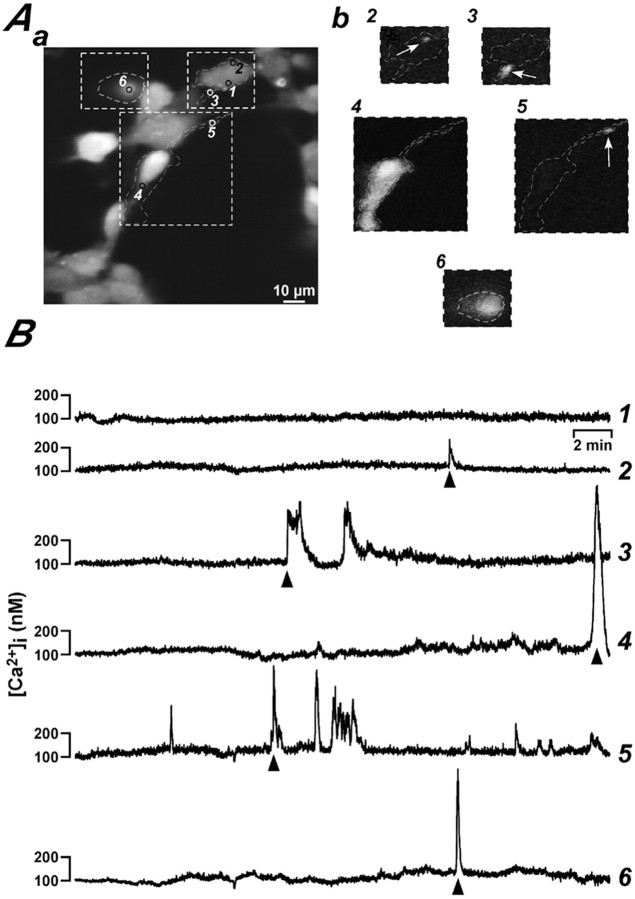
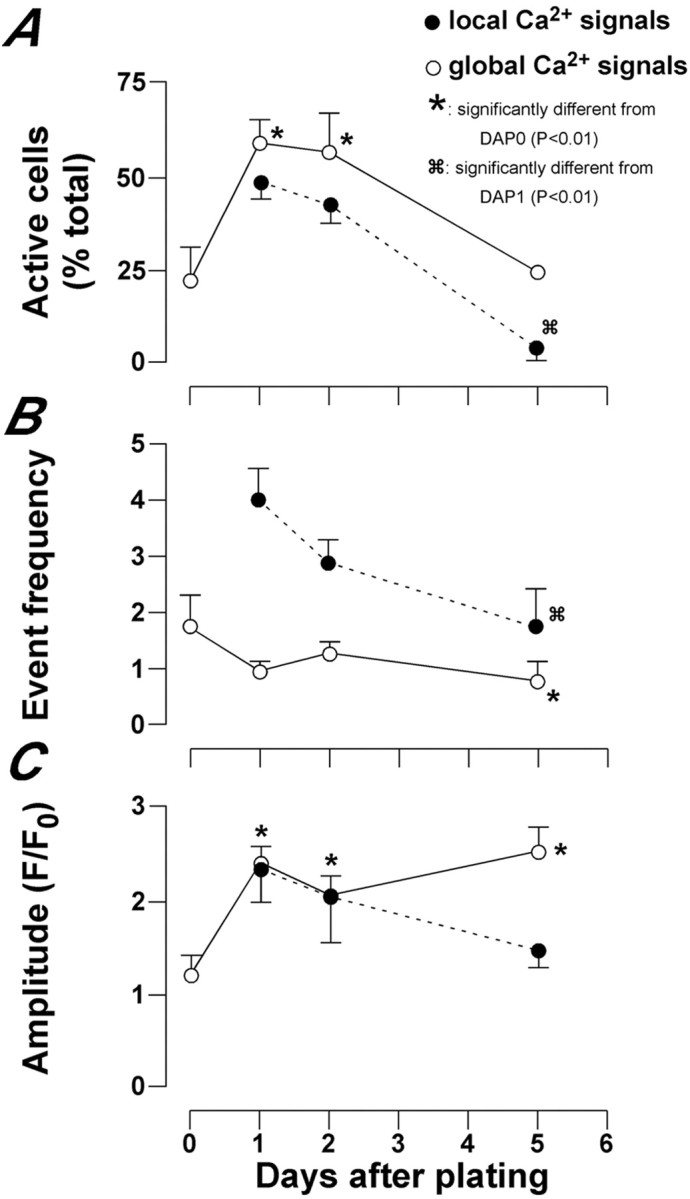
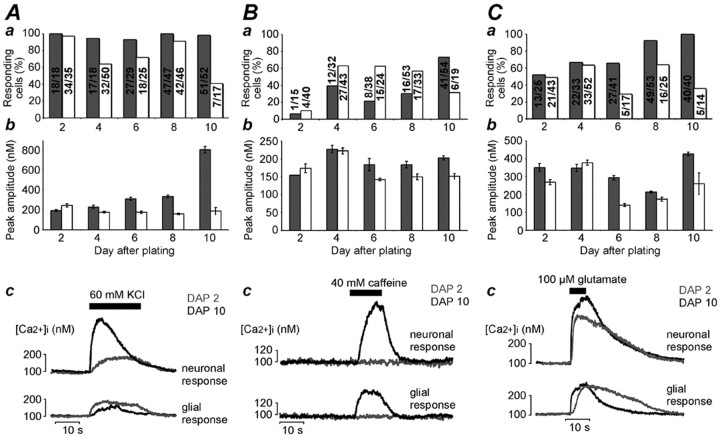
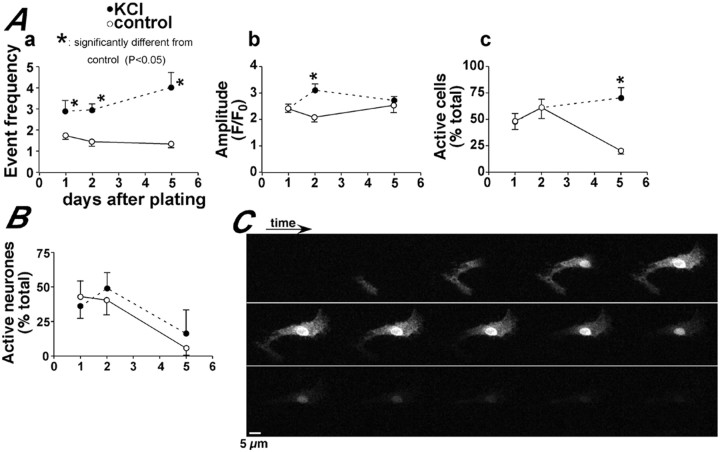
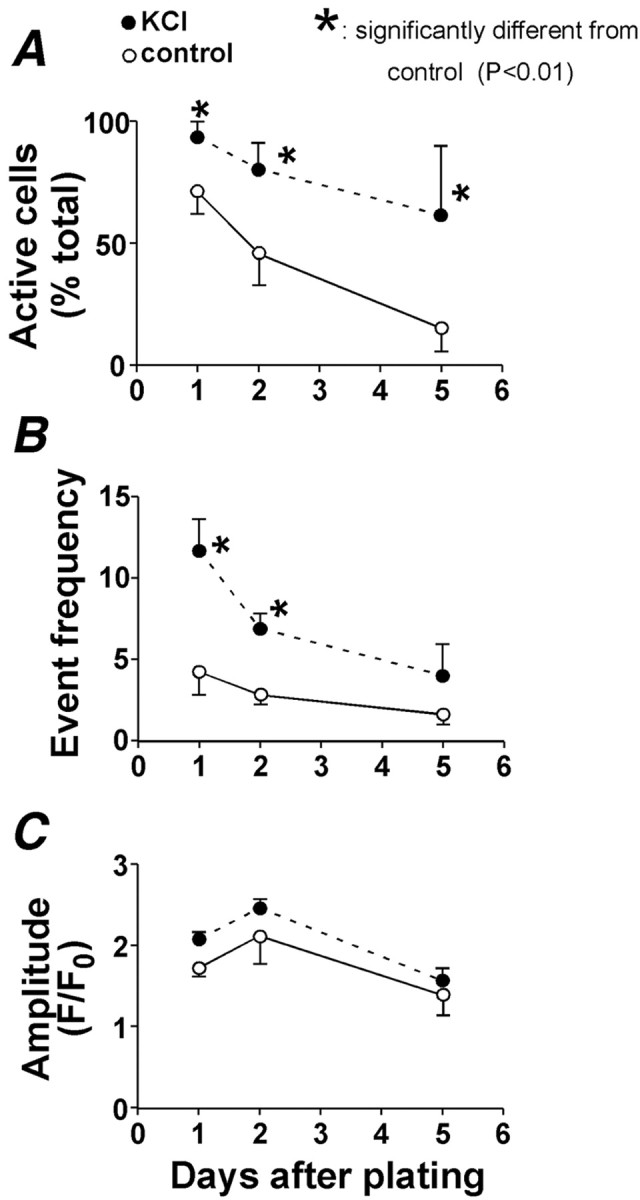
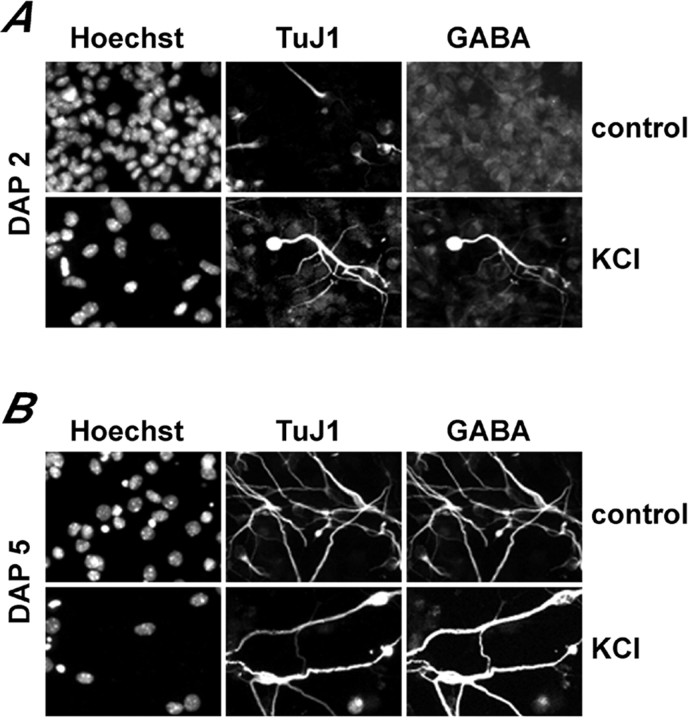
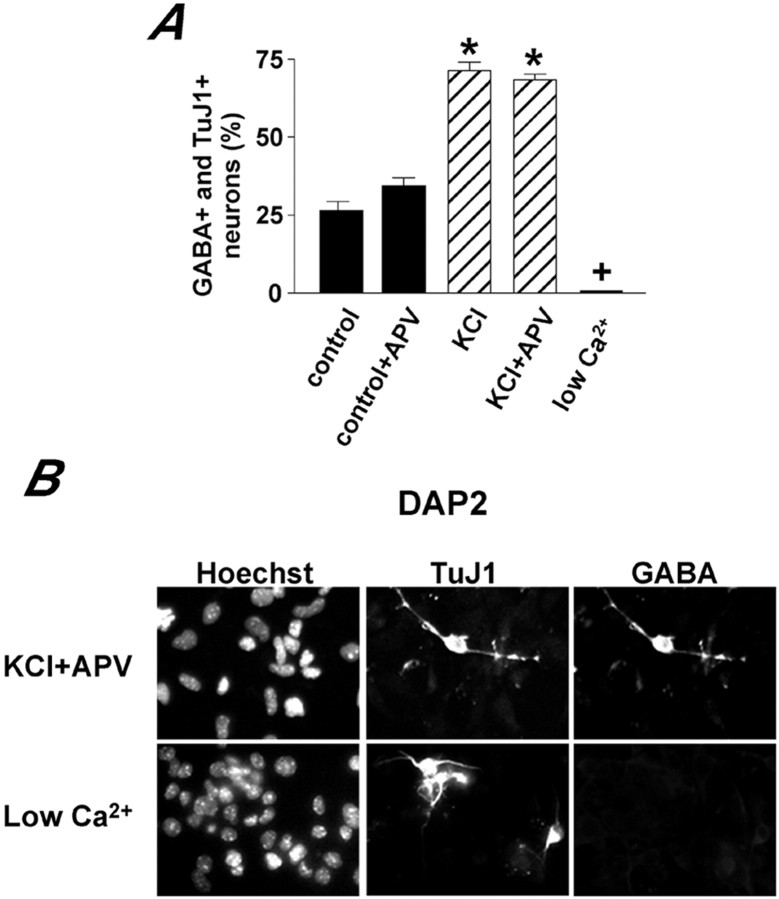
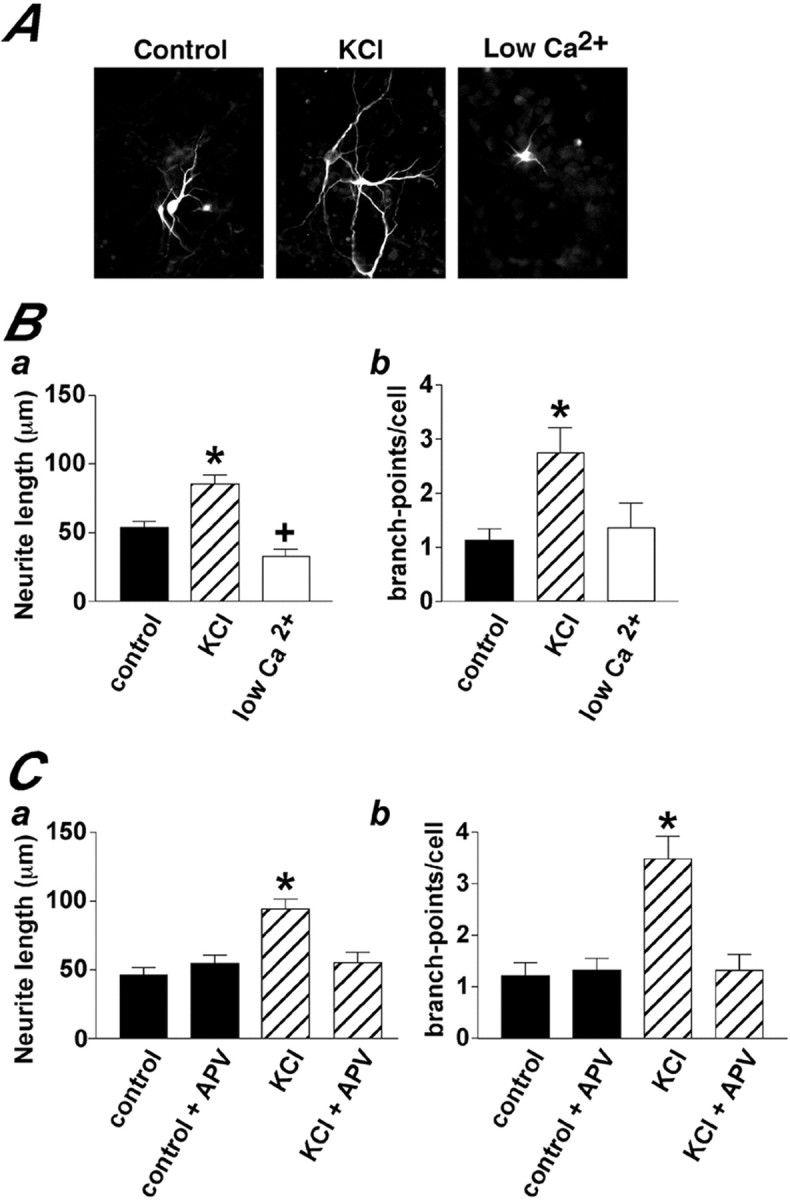
Neural stem cells can generate in vitro progenitors of the three main cell lineages found in the CNS. The signaling pathways underlying the acquisition of differentiated phenotypes in these cells are poorly understood. Here we tested the hypothesis that Ca(2+) signaling controls differentiation of neural precursors. We found low-frequency global and local Ca(2+) transients occurring predominantly during early stages of differentiation. Spontaneous Ca(2+) signals in individual precursors were not synchronized with Ca(2+) transients in surrounding cells. Experimentally induced changes in the frequency of local Ca(2+) signals and global Ca(2+) rises correlated positively with neurite outgrowth and the onset of GABAergic neurotransmitter phenotype, respectively. NMDA receptor activity was critical for alterations in neuronal morphology but not for the timing of the acquisition of the neurotransmitter phenotype. Thus, spontaneous Ca(2+) signals are an intrinsic property of differentiating neurosphere-derived precursors. Their frequency may specify neuronal morphology and acquisition of neurotransmitter phenotype.


Figures

Fig. 1.
Fig. 1.
Expression of differentiation markers in cultured neurosphere-derived precursors. The panels show examples of double immunostaining identifying neurons (TuJ1 immunoreactive) and nestin-immunoreactive precursors (top row), astrocytes (GFAP immunoreactive) and precursors (middle row), and neurons and GABA-immunopositive cells (bottom row) in neurosphere-derived cultures grown for 7 d in the presence of EGF and FGF-2 and differentiated for an additional 2 d (DAP 2) and 6 d (DAP 6). Phase-contrast photographs of each field are shown in the right-hand column.
Fig. 2.
Fig. 2.
Examples of spontaneous local and global Ca2+ signals in neurosphere-derived precursors 1 d after induction of differentiation. Aa, Confocal image showing a field of cells loaded with Fluo3. Thenumbered circles indicate the subcellular regions from which Ca2+ changes were analyzed. Examples of the observed local and global Ca2+ signals are depicted in Ab. The traces in B show the time course of calcium signals from the correspondingly numbered regions inAa. The arrowheads beneath thetraces in B indicate the particular Ca2+ signals shown in Ab.
Fig. 3.
Fig. 3.
The occurrence of both global and local events decreases during differentiation. The graphs indicate the number of active cells (A), the frequency of events (number of events per cell or branch during a 10 min recording) (B), and the amplitude of the Ca2+ signals for both global and local responses after induction of differentiation (C). Please note that the local Ca2+ responses were measured from cells with neuronal morphology only. The global responses reflect glial and neuronal signals pooled, to show the decline of Ca2+ transients throughout the culture. The data represent the mean ± SEM of at least three independent experiments with an average of 69 cells analyzed for each time point.
Fig. 4.
Fig. 4.
Changes in Ca2+ signaling capacity of differentiating neurons and glial cells.AC indicate responses of neuronal (gray bars) and glial cells (white bars) to acute stimulation with KCl (A), caffeine (B), and glutamate (C). Mean ± SEM data are shown inAaCb. The numberson the bars in Aa, Ba, andCa indicate the fraction of responsive cells, with the denominator indicating the number of cells analyzed. The peak amplitude data were calculated using responsive cells only. Thetraces in AcCc show examples of the responses of single neuronal and glial cells at the earliest (DAP 2) and latest (DAP 10) time points tested. The traces were chosen randomly from matched experiments.
Fig. 5.
Fig. 5.
Membrane depolarization enhances global Ca2+ signals. AaAcillustrate the effect of 50 mm KCl on the characteristics of global Ca2+ signals at different days after induction of differentiation. Event frequency(Aa) indicates the number of events per cell or branch during a 10 min recording. The graph in Billustrates that the number of neurons showing global Ca2+ signals declined with or without KCl treatment. The data shown represent the mean ± SEM of at least three independent experiments in which an average of 154 cells were analyzed for each time point. The images in C illustrate an example of a global Ca2+ signal in a cell with astrocytic morphology at DAP 5. Images of the same cell are shown at 15 sec intervals, with time running from left toright and top tobottom.
Fig. 6.
Fig. 6.
Membrane depolarization enhances local Ca2+ signals. ACillustrate the effect of 50 mm KCl on the characteristics of local Ca2+ signals at different days after induction of differentiation. Event frequency(B) indicates the number of local Ca2+ signals observed during a 10 min recording. The data shown represent the mean ± SEM of at least three independent experiments in which an average of 76 cells were analyzed for each time point.
Fig. 7.
Fig. 7.
Effect of KCl treatment on GABA expression. Neurosphere-derived neurons were analyzed for TuJ1 and GABA expression at 2 d (A, DAP 2) and 5 d (B, DAP 5) after induction of differentiation. The Hoechst fluorescence is shown to indicate the position of the cell nuclei.
Fig. 8.
Fig. 8.
KCl and low Ca2+ modulate GABA expression. A shows a quantitative analysis of the number of TuJ1 and GABA double-immunopositive neurons found at DAP 2 in neurosphere cultures differentiating in the indicated conditions. The data represent mean ± SEM of at least three independent experiments. * p < 0.001, significantly different from control; + p < 0.05, significantly different from control. B shows examples of immunofluorescence recorded from cells treated as shown.
Fig. 9.
Fig. 9.
KCl and low Ca2+ modulate neuronal morphology. A shows examples of TuJ1-immunoreactive neurons found in cultures exposed for 24 hr to KCl, low Ca2+, or control conditions. *p < 0.01, significantly different from control;+p < 0.05, significantly different from control. B shows a quantitative summary of the effects of KCl and low Ca2+ conditions on neurite length and branch points. C illustrates the abolition of KCl-induced changes in neuronal morphology by the NMDA receptor blocker APV. The data represent mean ± SEM of at least three independent experiments.

References

    1. Berridge MJ, Bootman MD, Lipp P. Calcium—a life and death signal. Nature. 1998;395:645–648. - PubMed
    1. Blondel O, Collin C, Mc Carran WJ, Zhu S, Zamostiano R, Gozes I, Brenneman DE, Mc Kay RDG. A glia-derived signal regulating neuronal differentiation. J Neurosci. 2000;20:8012–8020. - PMC - PubMed
    1. Bootman MD, Lipp P, Berridge MJ. The organisation and functions of local Ca2+ signals. J Cell Sci. 2001;114:2213–2222. - PubMed
    1. Carey MB, Matsumoto SG. Spontaneous calcium transients are required for neuronal differentiation of murine neural crest. Dev Biol. 1999;215:289–313. - PubMed
    1. Cheng H, Lederer WJ, Cannell MB. Calcium sparks elementary events underlying excitation-contraction coupling in heart muscle. Science. 1993;262:740–744. - PubMed

Publication types

Substances