. 2003 Jan 1;23(1):277-86.
doi: 10.1523/JNEUROSCI.23-01-00277.2003.

The C264Y missense mutation in the extracellular domain of L1 impairs protein trafficking in vitro and in vivo

Affiliations

The C264Y missense mutation in the extracellular domain of L1 impairs protein trafficking in vitro and in vivo

Annette E Rünker et al. J Neurosci. .

Abstract

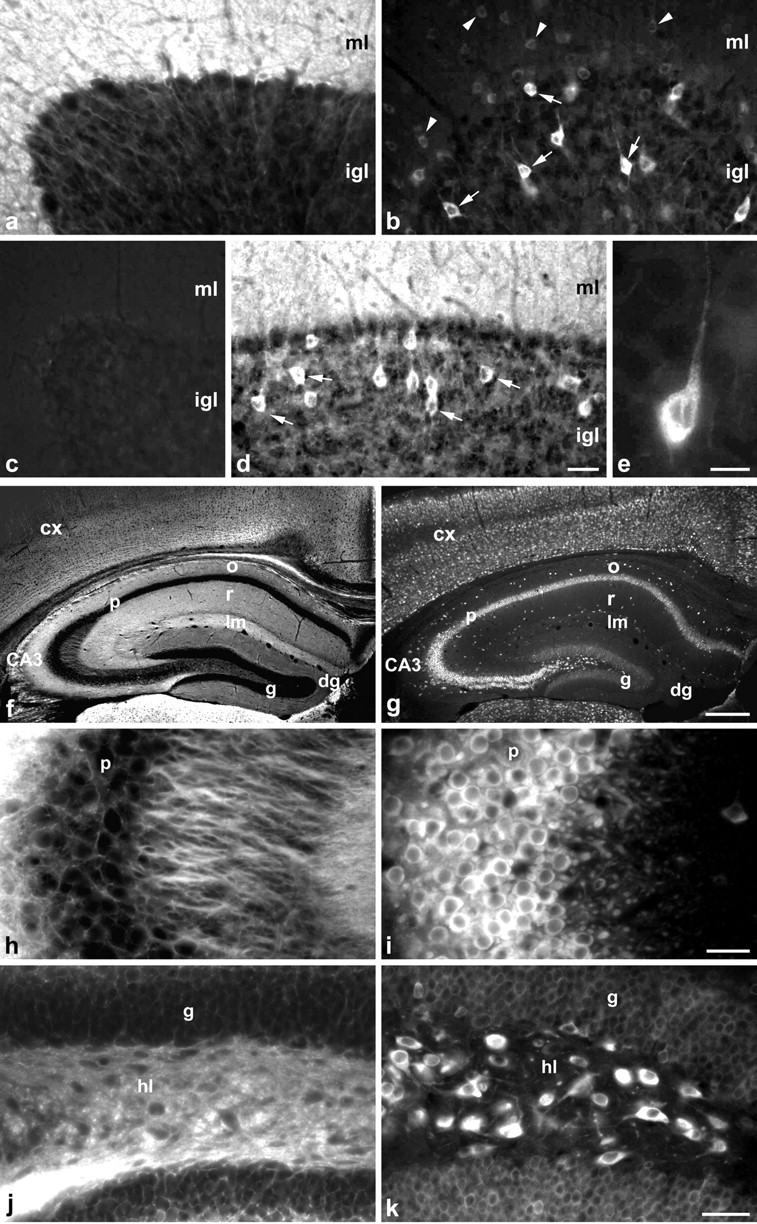
The neural cell adhesion molecule L1, a member of the immunoglobulin superfamily, performs important functions in the developing and adult nervous system and is implicated in neuronal migration and survival, elongation, fasciculation and pathfinding of axons, and synaptic plasticity. This view is in line with the fact that mutations in the L1 gene result in severe neurological syndromes in humans. Patients with missense mutations in the extracellular domain of L1 often develop severe phenotypes. Here, we characterized in vitro and in vivo the missense mutation C264Y, which is located in the extracellular domain of L1 and causes a severe phenotype in humans. Transfection studies in vitro demonstrate that L1 carrying this missense mutation is not expressed at the cell surface but instead is located intracellularly, most likely within the endoplasmic reticulum. Lack of cell surface expression of L1 with a C264Y mutation was confirmed in a transgenic mouse line expressing the C264Y mutation under the control of the L1 promoter in an L1-deficient background. Analysis of these transgenic mice indicates that they represent functional null mutants, phenotypically indistinguishable from L1-deficient mice. These observations corroborate the view that impaired cell surface expression of mutated variants of L1 is a potential explanation for the high number of severe pathogenic mutations identified within the human L1 gene.


Figures

Fig. 1.
Fig. 1.
ae, Indirect L1-immunofluorescence staining of live CHO cells 36 hr after transient transfection with L1wt (a), sL1 (b), L1ex (c), L1Δhbs (d), and L1C264Y (e;f is the phase-contrast photomicrograph ofe) using mAb555. Most of the cells in cultures transfected with L1wt (a), sL1 (b), and L1ex (c) are labeled by L1 antibodies. In contrast, only a few L1-positive cells are detectable in cultures transfected with L1Δhbs (d) or L1C264Y (e).g, CHO cells were stably transfected with L1wt, L1ex, L1Δhbs, and L1C264Y, and the percentage of cells expressing L1 on their surface was determined using FACS (the percentage of L1-immunoreactive cells in cultures transfected with L1wt was set to 100%). A similar percentage of cells with surface expression of L1 is present in cultures transfected with L1wt and L1ex. In comparison, L1-positive cells are hardly detectable in cultures transfected with L1Δhbs or L1C264Y. Mock-transfected CHO cells served as a negative control. Error bars represent mean values ± SD of six independent experiments for each construct.n.s., Not significantly different from L1wt; *, significantly different from L1wt (p < 0.01; Mann–Whitney test). Scale bar (shown in f): af, 100 μm.
Fig. 2.
Fig. 2.
L1-immunoblot analysis of transiently (a) (36 hr after transfection) and stably (b) transfected CHO cells. L1-immunoreactive bands at 220 and 190 kDa are detectable in cultures transfected with L1wt, sL1, and L1ex (a). The reduced molecular weight of L1 in cells transfected with L1ex is related to lack of the intracellular domain. In cultures transiently transfected with L1Δhbs or L1C264Y (a), the 190 kDa form of L1 is strongly expressed, whereas the 220 kDa form is hardly detectable.b, The 220 and 190 kDa forms of L1 are expressed in cultures stably transfected with L1wt (b), whereas only the 190 kDa band is detectable in cultures stably transfected with L1Δhbs or L1C264Y [shown are results from two (#1 and #2) of eight independent experiments for each construct]. Immunoblot analysis ina and b was performed with the L1 antibody mAb555, and mouse brain homogenates were included as an internal positive control. Mock-transfected CHO cells served as a negative control (a).
Fig. 3.
Fig. 3.
af, Extracted biotinylated cell surface proteins (a, d) and whole-cell lysates (b, e) from transiently transfected CHO cells (a, b, 48 hr after transfection; d, e, 72 hr after transfection) were subjected to L1-immunoblot analysis. Intensities of immunoreactive bands of biotinylated proteins were determined and related to L1wt (set to 100% in each blot;c, f). Analysis of biotinylated proteins from CHO cells transfected with L1wt, sL1, and L1ex reveals a prominent band at 220 kDa at both time points after transfection (a, d). In cultures transfected with L1Δhbs and L1C264Y, in comparison, the 220 kDa form of L1 is only weakly expressed 48 hr after transfection (a,c) and hardly detectable 72 hr (d,f) after transfection. Note that the 190 kDa form of L1 is absent from biotinylated protein extracts of all transfectants (a, d). Note also the ∼50% decrease in the amount of cell surface-associated L1 in L1Δhbs- and L1C264Y-transfected cultures between 48 and 72 hr after transfection (compare c, f). g, L1-immunoblot analysis of transiently transfected CHO cells (72 hr after transfection) either without (−H) or after (+H) digestion with endo H. Treatment with endo H does not alter the molecular weight of the 220 kDa form of L1, whereas it reduces the molecular weight of the 190 kDa form to 150 kDa. Error bars in c andf represent the mean values ± SD of two independent experiments.
Fig. 4.
Fig. 4.
Brain homogenates from 17.5-d-old wt and L1C264Y-transgenic embryos were subjected to L1-immunoblot analysis either without (−H) or after (+H) digestion with endo H. In undigested samples, the characteristic L1-immunoreactive bands at 200 and 140 kDa (a proteolytic cleavage product of L1) are detectable in wt mice. Brain homogenates from L1C264Y-transgenic mice, in comparison, contain a 190 kDa instead of a 200 kDa band and lack the 140 kDa proteolytic cleavage product of L1. L1 protein from wt mice is insensitive to endo H treatment, whereas endo H digestion of brain homogenates from L1C264Y-transgenic mice results in a shift of the 190 kDa band to 150 kDa.
Fig. 5.
Fig. 5.
L1-immunohistochemistry of the cerebellum (ae) and the hippocampus (fk) of 2-month-old wt (a, f, h,j), L1C264Y (b, e,g, i, k), L1-/y (c), and L1+/y_C264Y (d) mice. Intense and homogenously distributed L1 immunoreactivity is visible in fiber-rich brain regions of wt mice, including the molecular layer of the cerebellum (a) or the strata oriens, radiatum, and lacunosum moleculare of the hippocampus (f, h, j). Regions rich in cell bodies, such as the internal granular layer of the cerebellum (a) or the pyramidal and granule cell layer of the hippocampus (f, h,j), are only weakly L1 immunoreactive in wt mice. In contrast, L1-positive fibers are absent from the cerebellar cortex (b) or the hippocampus (g,i, k) of L1C264Y mice. Instead, intense intracellular labeling of Golgi cells (some labeled witharrows in b; e) and weaker intracellular labeling of basket and stellate cells (some labeled witharrowheads in b) are visible in the cerebellar cortex of L1C264Y mice. In the hippocampus of these mutants, cell bodies of pyramidal cells (i) and hilar interneurons (k) are strongly stained by L1 antibodies. Intracellular labeling is also visible for other nerve cell types, such as granule cells in the cerebellar cortex (b) or dentate gyrus (k). In L1+/y_C264Y mice, fiber tracts are homogeneously and nerve cell bodies intracellularly labeled by L1 antibodies (d; some immunoreactive Golgi cells are labeled with arrows). Sections from L1-/y mice incubated with L1 antibodies were immunonegative (c). cx, Cortex;dg, dentate gyrus; g, granule cell layer;hl, hilus; igl, internal granule cell layer; lm, stratum lacunosum moleculare;ml, molecular layer; o, stratum oriens;p, pyramidal cell layer; r, stratum radiatum. Scale bars: shown in d forad, 25 μm; e, 10 μm; shown in g for f and g, 200 μm; shown in i for h andi, 20 μm; shown in k forj and k, 20 μm.
Fig. 6.
Fig. 6.
af, Anterograde tracing of corticospinal axons in wt (a,b), L1-/y (c, d), and L1C264Y mice (e, f), and analysis of their trajectory at the pyramidal decussation. In wt mice, corticospinal axons cross the midline (indicated byarrowheads in af) at the pyramidal decussation and extend to the dorsal column (a, b). In L1-/y mice, corticospinal axons display pronounced pathfinding errors at the pyramidal decussation, and either project bilaterally to the dorsal column (c) or cross the midline but stay ventral instead of projecting dorsally (d). A bilateral projection of corticospinal axons to the dorsal column (e) or a projection to the contralateral pyramid (f) is also detectable in L1C264Y-transgenic mice. gj, The size of the CST of L1-/y (h) and L1C264Y mice (i) is significantly reduced compared with wt mice (g). Quantitative analysis (j) reveals a similar size of the corticospinal tract (CST) in wt (n = 7) and L1+/y_C264Y (n = 3) mice. In comparison, the size of the CST is significantly reduced to a similar extent in L1-/y (n = 5) and L1C264Y (n = 5) mice. Error bars in j represent mean values ± SD.n.s., Not significantly different from wt; *, significantly different from wt (p < 0.01; Mann–Whitney test). Scale bars: a, 200 μm; bf, 100 μm; shown ini for gi, 100 μm.
Fig. 7.
Fig. 7.
Ultrastructure of unmyelinated fibers in the sciatic nerve of wt (a), L1-/y (b), and L1C264Y (c) mice. Axons in wt (a) mice are ensheathed and separated from each other by Schwann cell processes. In L1y/- (b) and L1C264Y (c) mice, in contrast, a portion of axons (labeled with asterisks) is not covered by a Schwann cell process, and many nonmyelinating Schwann cells extend supernumerary processes (labeled witharrowheads) into the endoneurial space. Note also the reduced number of axons associated with one nonmyelinating Schwann cell in L1-/y (b) and L1C264Y (c) mice compared with wt animals (a). Quantitative analysis (df) reveals a significant increase in the number of incompletely ensheathed axons per nonmyelinating Schwann cell (d), a significant increase in the number of nonmyelinating Schwann cells extending one or more supernumerary processes into the endoneurium (e), and a significant decrease in the number of axons associated with one nonmyelinating Schwann cell (f) in L1-/y and L1C264Y mice when compared with wt animals. Note that values for L1-/y and L1C264Y mice are not significantly different from each other for all parameters analyzed (df). Error bars indf represent mean values ± SD from six animals of each genotype. n.s., Not significantly different; *, significantly different (p < 0.01; Mann–Whitney test).ax, Myelinated axon; mSC, myelinating Schwann cell; nSC, nonmyelinating Schwann cell;SC-processes, Schwann cell processes. Scale bar (shown in c for ac): 1 μm.

References

    1. Appel F, Holm J, Conscience JF, von Bohlen und Halbach F, Faissner A, James P, Schachner M. Identification of the border between fibronectin type III homologous repeats 2 and 3 of the neural cell adhesion molecule L1 as a neurite outgrowth promoting and signal transducing domain. J Neurobiol. 1995;28:297–312. - PubMed
    1. Bateman A, Jouet M, MacFarlane J, Du JS, Kenwrick S, Chothia C. Outline structure of the human L1 cell adhesion molecule and the sites where mutations cause neurological disorders. EMBO J. 1996;15:6050–6059. - PMC - PubMed
    1. Bennett V, Chen L. Ankyrins and cellular targeting of diverse membrane proteins to physiological sites. Curr Opin Cell Biol. 2001;13:61–67. - PubMed
    1. Bone LJ, Deschenes SM, Balice-Gordon RJ, Fischbeck KH, Scherer SS. Connexin32 and X-linked Charcot-Marie-Tooth disease. Neurobiol Dis. 1997;4:221–230. - PubMed
    1. Bross P, Corydon TJ, Andresen BS, Jorgensen MM, Bolund L, Gregersen N. Protein misfolding and degradation in genetic diseases. Hum Mutat. 1999;14:186–198. - PubMed

MeSH terms

Substances