. 2003 Jan 1;23(1):287-96.
doi: 10.1523/JNEUROSCI.23-01-00287.2003.

Provision of brain-derived neurotrophic factor via anterograde transport from the eye preserves the physiological responses of axotomized geniculate neurons

Affiliations

Provision of brain-derived neurotrophic factor via anterograde transport from the eye preserves the physiological responses of axotomized geniculate neurons

Matteo Caleo et al. J Neurosci. .

Abstract

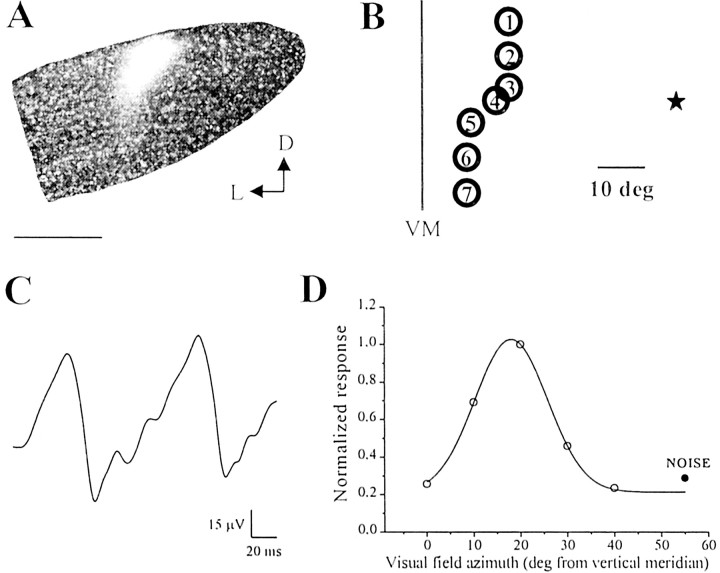
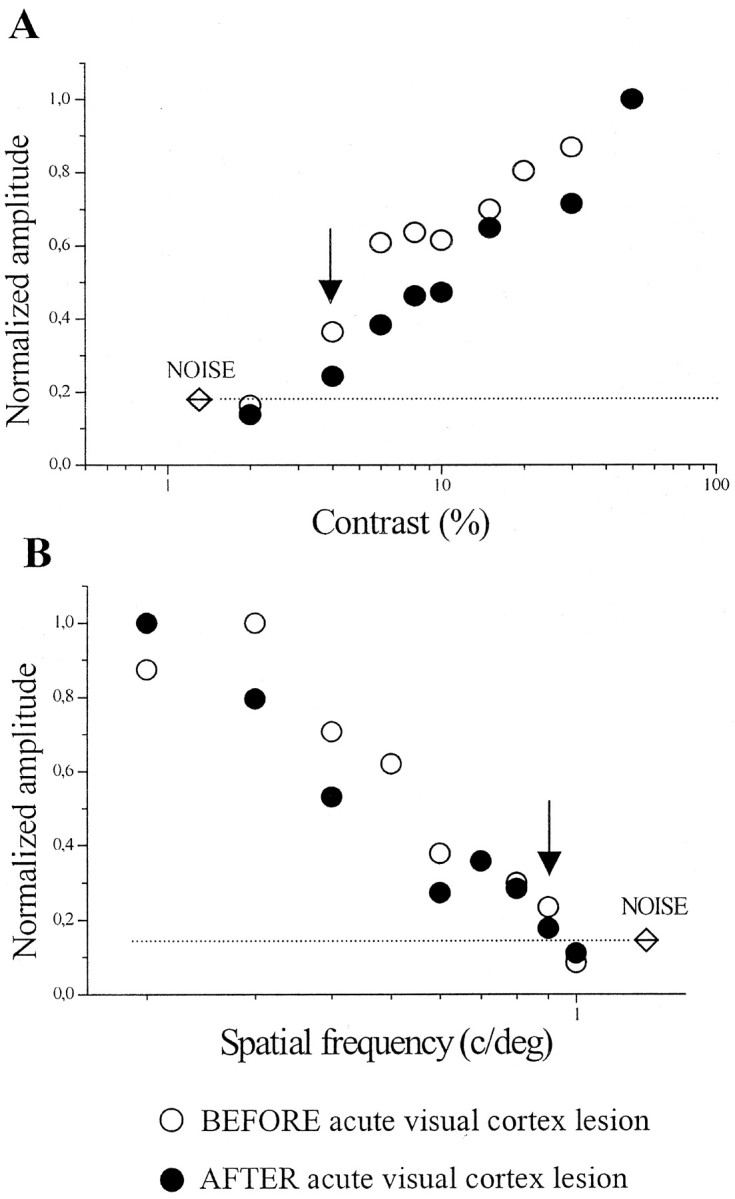
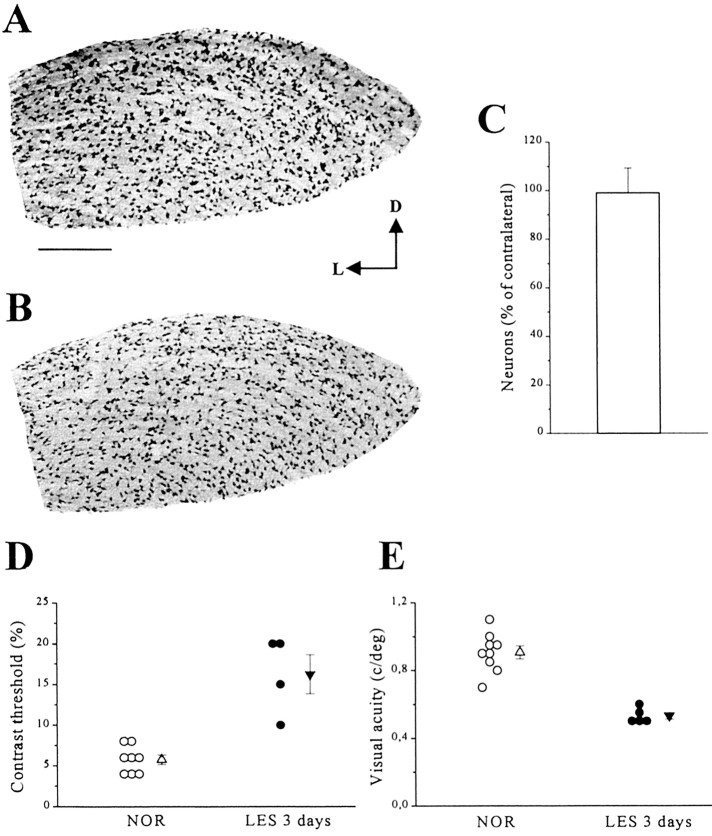
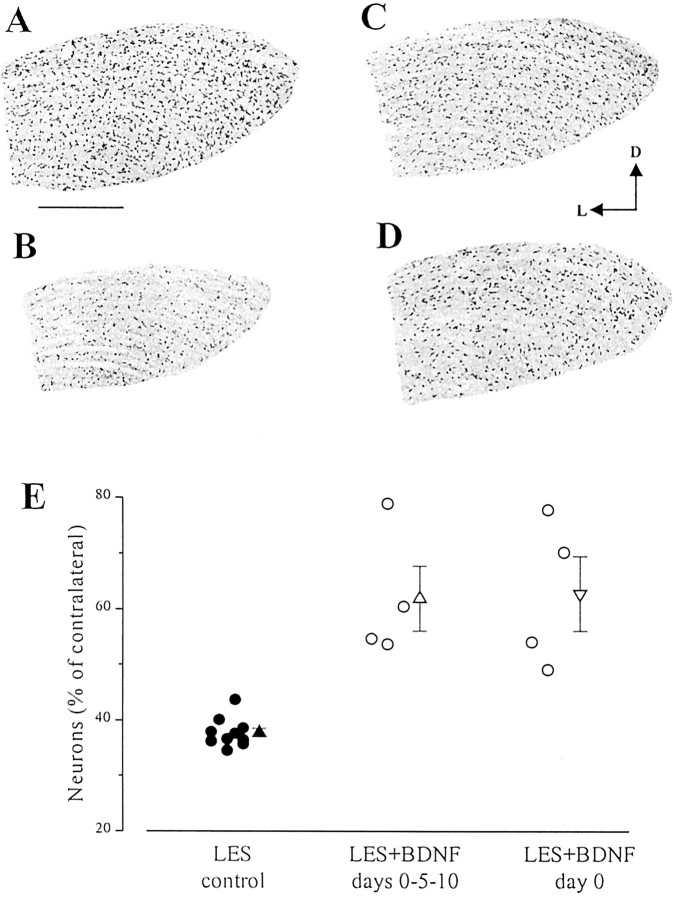
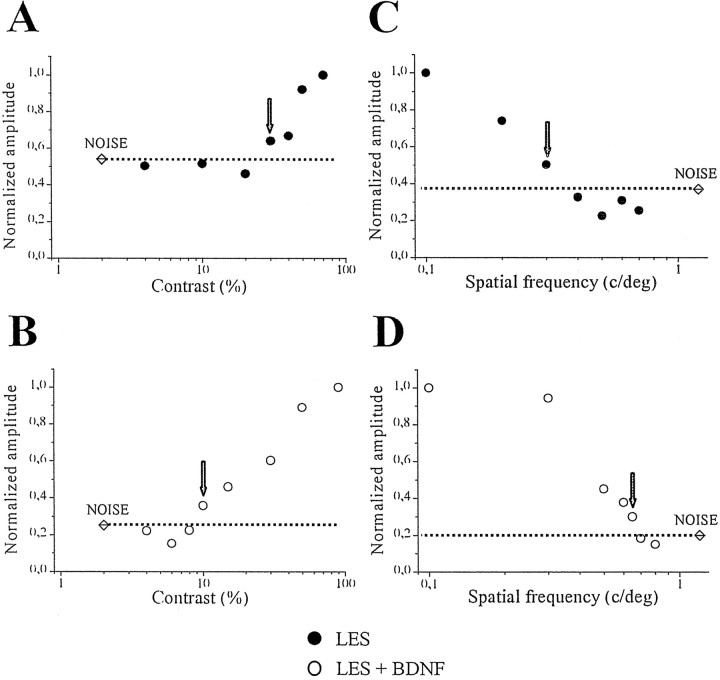
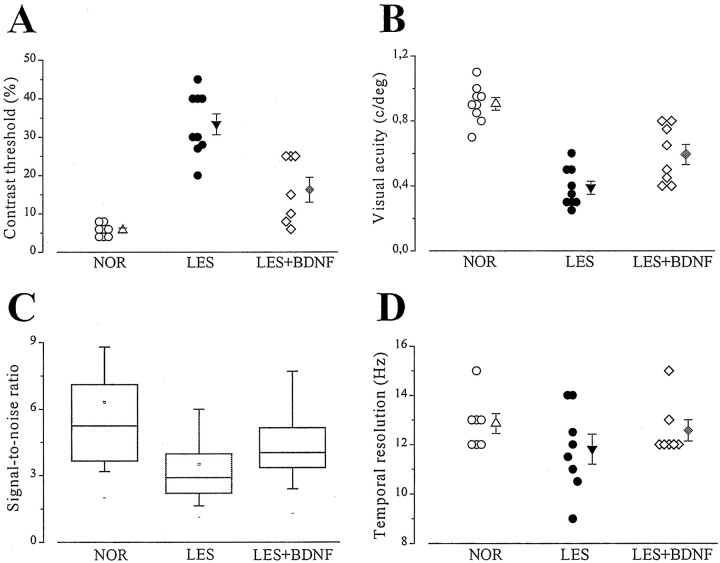
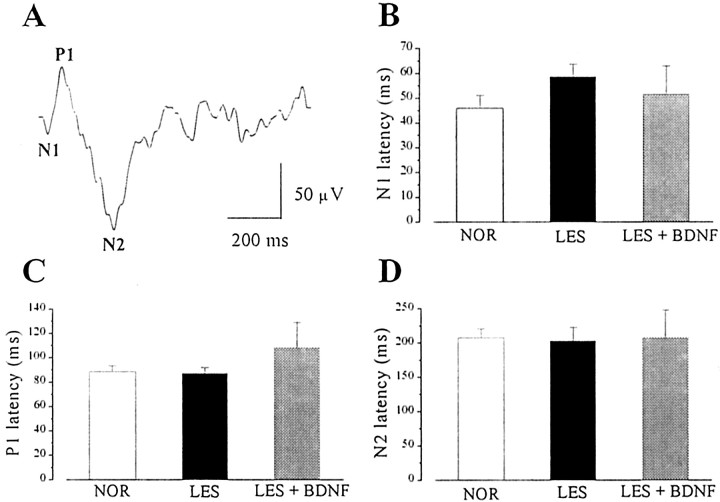
The neurotrophic factors of the nerve growth factor family (neurotrophins) have been shown to promote neuronal survival after brain injury and in various models of neurodegenerative conditions. However, it has not been determined whether neurotrophin treatment results in the maintenance of function of the rescued cells. Here we have used the retrograde degeneration of geniculate neurons as a model system to evaluate neuronal rescue and sparing of function after administration of brain-derived neurotrophic factor (BDNF). Death of geniculate neurons was induced by a visual cortex lesion in adult rats, and exogenous BDNF was delivered to the axotomized geniculate cells via anterograde transport after injection into the eye. By microelectrode recordings from the geniculate in vivo we have measured several physiological parameters such as contrast threshold, spatial resolution (visual acuity), signal-to-noise ratio, temporal resolution, and response latency. In control lesioned animals we found that geniculate cell dysfunction precedes the onset of neuronal death, indicating that an assessment of neuronal number per se is not predictive of functional performance. The administration of BDNF resulted in a highly significant cell-saving effect up to 2 weeks after the cortical damage and maintained nearly normal physiological responses in the geniculate. This preservation of function in adult axotomized neurons suggests possible therapeutic applications of BDNF.


Figures

Fig. 1.
Fig. 1.
A, Fluorescence photomicrograph of a coronal section through the dLGN. The position of the recording microelectrode is marked by a DiI deposit located in the dorsal portion of the nucleus. The section has been lightly counterstained with Hoechst dye. D, Dorsal; L, lateral. Scale bar, 300 μm. B, Typical progression of the RF centers of single geniculate units along a micropipette track. Thecircles indicate the RF centers, and thenumbers within the circles indicate the sequence in which these neurons were encountered as the electrode was moved dorsoventrally. The cells were recorded at an interdistance of 100 μm from each other. Optic disk position is indicated by anasterisk. VM, Vertical meridian.C, Example of a geniculate steady-state VEP. The stimulus was a horizontal sine wave grating (spatial frequency, 0.1 c/deg; contrast, 90%; mean luminance, 15 cd/m2) reversed sinusoidally in contrast at 5 Hz. D, Retinotopy of geniculate VEPs. Recordings from the same penetration depicted inB and performed in correspondence to the single unit with RF 3. The visual stimulus has been windowed to a vertical stripe subtending 10° of visual angle and placed at different visual field azimuths. It is clear that there is a visual field azimuth yielding maximal response and corresponding to the RF position at which the VEP was recorded. VEP amplitude rapidly falls off for non-optimal stimulus positions, becoming indistinguishable from noise for windows centered farther then 20° from the RF position. Data have been fitted with a Gaussian curve. An identical behavior is observed when the visual stimulus is windowed to a horizontal stripe of 10° presented at different elevations. In this case, the VEP response vanishes when the horizontal stripe is shifted farther than 20° (either up or down in the visual field) from the RF position (data not shown in the figure).
Fig. 2.
Fig. 2.
Effects of acute visual cortex lesion on contrast threshold and visual acuity. A, Variation of VEP amplitude with contrast of the stimulus grating. Eachpoint has been obtained by averaging data from three measures. An identical contrast threshold (last point above noise level; indicated by an arrow) is obtained in the same animal before (○) and 2 hr after (●) a complete ablation of the occipital cortex. Visual stimulus: horizontal sine wave grating of variable contrast, reversed sinusoidally at 4 Hz, spatial frequency 0.1 c/deg. B, VEP amplitude as a function of spatial frequency for a normal geniculate (○) and the same geniculate 2 hr after (●) removal of the cortex. Both curves reach the noise level at 1 c/deg. Visual stimulus: horizontal sine wave grating of variable spatial frequency, reversed sinusoidally at 4 Hz, contrast 90%.
Fig. 3.
Fig. 3.
Early physiological changes precede the loss of geniculate neurons. A, B, Coronal sections through the geniculate immunostained for neurons using anti-NeuN antibodies. The geniculate of an animal in which the ipsilateral visual cortex was ablated 3 d earlier (B) is grossly normal and not readily distinguishable from the geniculate of an intact animal (A). D, Dorsal; L, lateral. Scale bar, 200 μm. C, Stereological quantification of neuronal survival 3 d after lesion. The histogram represents mean ± SE of the percentage of neurons counted on the lesioned side with respect to those present in the contralateral, intact dLGN (n = 5 rats).D, E, Summary of contrast sensitivity (D) and visual acuity data (E) in normal rats and rats recorded 3 d after visual cortex lesion. Each circle represents the value obtained in one animal. Triangles indicate the mean. Error bars indicate SE and, when not seen, are within the symbol.
Fig. 4.
Fig. 4.
Intraocular administration of BDNF prevents the death of geniculate neurons. AD, Coronal sections through the dLGN immunostained with anti-NeuN antibodies. At postoperative day 14, the geniculate of control lesioned animals (B) is shrunken, and the number of dLGN neurons is reduced dramatically with respect to normal (A). Many more neurons survive in animals with either three BDNF injections (C) or one single BDNF injection (D). D, Dorsal;L, lateral. Scale bar, 300 μm. E, Scatter plot showing survival data in the various experimental groups. For each animal, the total number of dLGN neurons has been estimated by unbiased stereology on the side ipsilateral to the lesion and on the contralateral control side. Each circle represents survival in one animal. The lesion group (left) includes both untreated lesioned rats and lesioned rats that received intravitreal injections of cytochrome c.Triangles indicate the mean value for each experimental group; error bars indicate SE and, when not seen, are within the symbol.
Fig. 5.
Fig. 5.
Typical contrast threshold and visual acuity curves in control lesioned (top) and lesioned (bottom) rats with a single injection of BDNF. In each graph, an arrow indicates the last point above noise level (marked by a dotted line) that was taken as the threshold in that animal. It is evident from these examples that both contrast threshold and spatial resolution are improved by the BDNF treatment.
Fig. 6.
Fig. 6.
Contrast threshold (A), visual acuity (B), signal-to-noise (C), and temporal resolution (D) in the various experimental groups. The control lesioned group (LES) includes lesioned, untreated animals and lesioned animals that received intraocular injections of cytochrome c. BDNF-treated group (LES+BDNF) pools data from animals with repeated or single doses of BDNF. In A, B, andD, single data points and mean ± SE are shown. InC, non-normally distributed signal-to-noise ratio data are summarized with a box chart. The horizontal lines in the box denote the 25th, 50th, and 75th percentile values. The error bars denote the 5th and 95th percentile values.
Fig. 7.
Fig. 7.
A, Representative example of a transient VEP recorded in the dLGN contralateral to the stimulated eye of a normal animal showing three major waves (N1,P1, and N2) with different latencies. The visual stimulus was a horizontal square-wave grating (spatial frequency 0.1 c/deg, 90% contrast, mean luminance 15 cd/m2, 75° × 96° field size) reversed in contrast at 0.5 Hz. B–D, The histograms represent mean and SE of the latency of each major VEP component in the various animal groups. Latencies do not differ significantly between the groups (one-way ANOVA; N1 and P1 latency, p = 0.6; N2 latency, p = 0.99). For each histogram,n = 7–8 rats.

References

    1. Agarwala S, Kalil RE. Axotomy-induced neuronal death and reactive astrogliosis in the lateral geniculate nucleus following a lesion of the visual cortex in the rat. J Comp Neurol. 1998;392:252–263. - PubMed
    1. Al-Abdulla NA, Portera-Cailliau C, Martin LJ. Occipital cortex ablation in adult rat causes retrograde neuronal death in the lateral geniculate nucleus that resembles apoptosis. Neuroscience. 1998;86:191–209. - PubMed
    1. Blesch A, Grill RJ, Tuszynski MH. Neurotrophin gene therapy in CNS models of trauma and degeneration. Prog Brain Res. 1998;117:473–484. - PubMed
    1. Butowt R, von Bartheld CS. Sorting of internalized neurotrophins into an endocytic transcytosis pathway via the Golgi system: ultrastructural analysis in retinal ganglion cells. J Neurosci. 2001;21:8915–8930. - PMC - PubMed
    1. Caleo M, Menna E, Chierzi S, Cenni MC, Maffei L. Brain-derived neurotrophic factor is an anterograde survival factor in the rat visual system. Curr Biol. 2000;10:1155–1161. - PubMed

Publication types

MeSH terms

Substances

LinkOut - more resources