. 2003 Feb;10(2):109-14.
doi: 10.1038/nsb885.

Structure of the proline dehydrogenase domain of the multifunctional PutA flavoprotein

Affiliations

Structure of the proline dehydrogenase domain of the multifunctional PutA flavoprotein

Yong-Hwan Lee et al. Nat Struct Biol. 2003 Feb.

Abstract

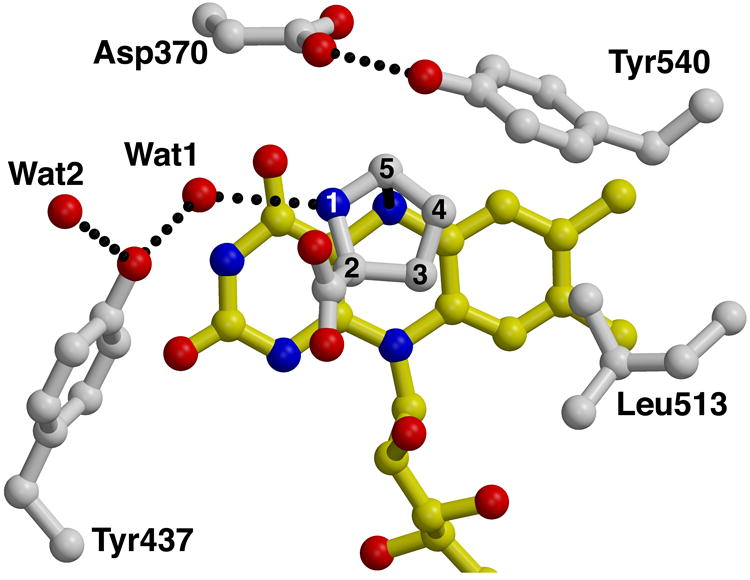
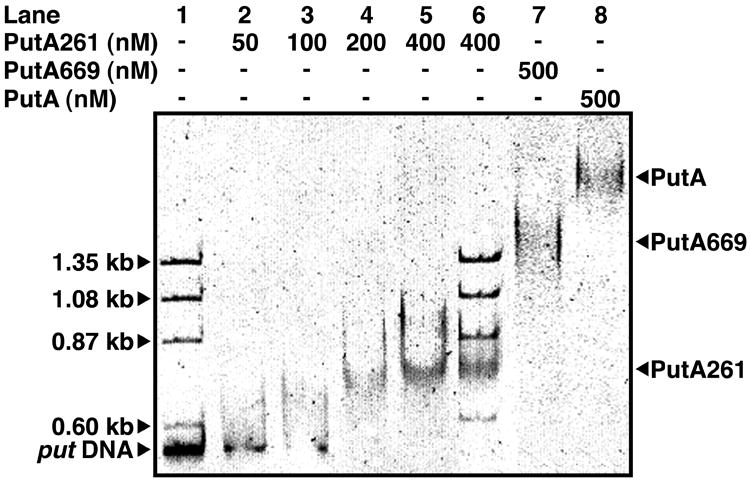
The PutA flavoprotein from Escherichia coli plays multiple roles in proline catabolism by functioning as a membrane-associated bi-functional enzyme and a transcriptional repressor of proline utilization genes. The human homolog of the PutA proline dehydrogenase (PRODH) domain is critical in p53-mediated apoptosis and schizophrenia. Here we report the crystal structure of a 669-residue truncated form of PutA that shows both PRODH and DNA-binding activities, representing the first structure of a PutA protein and a PRODH enzyme from any organism. The structure is a domain-swapped dimer with each subunit comprising three domains: a helical dimerization arm, a 120-residue domain containing a three-helix bundle similar to that in the helix-turn-helix superfamily of DNA-binding proteins and a beta/alpha-barrel PRODH domain with a bound lactate inhibitor. Analysis of the structure provides insight into the mechanism of proline oxidation to pyrroline-5-carboxylate, and functional studies of a mutant protein suggest that the DNA-binding domain is located within the N-terminal 261 residues of E. coli PutA.


Figures

Figure 1
Figure 1
Reactions catalyzed by the E. coli PutA protein. PutA669 catalyzes only the first reaction, the conversion of proline to P5C.
Figure 2
Figure 2
Overall structure of PutA669. a, Stereo-view of the homodimer, with domain I colored yellow (87-139), domain II blue (140-260), and domain III red/green (261-612). Selected residue numbers of one subunit are indicated. b, Cylinder drawing of domain II. The helices are labeled D-I, and the dashed curves represent disordered residues. c, Domain III, the PRODH domain, looking into the barrel. The helices are colored red and labeled 0-11, while the strands are colored green and labeled 1-8. Note that strands 5-8 are hidden by α-helix 8. The FAD cofactor is drawn as a ball-and-stick model in yellow. This and other figures were prepared with Molscript and Raster3d .
Figure 2
Figure 2
Overall structure of PutA669. a, Stereo-view of the homodimer, with domain I colored yellow (87-139), domain II blue (140-260), and domain III red/green (261-612). Selected residue numbers of one subunit are indicated. b, Cylinder drawing of domain II. The helices are labeled D-I, and the dashed curves represent disordered residues. c, Domain III, the PRODH domain, looking into the barrel. The helices are colored red and labeled 0-11, while the strands are colored green and labeled 1-8. Note that strands 5-8 are hidden by α-helix 8. The FAD cofactor is drawn as a ball-and-stick model in yellow. This and other figures were prepared with Molscript and Raster3d .
Figure 3
Figure 3
The active site of PutA669. a, Stereo-view of a σA-weighted, simulated annealing, Fo-Fc omit electron density map (2.5 σ) covering the bound L-lactate inhibitor (white). FAD is drawn in yellow. This figure was prepared with Bobscript. b, Stereo-view of the active site with FAD shown in yellow, and amino acid side chains and lactate inhibitor in white. The dotted lines represent hydrogen bonds and ion pairs. Helix α8 is shown in red. c, d, Two orthogonal views of a model of the substrate proline bound to the active site. Proline appears in white with its atom numbered. The dotted lines represent hydrogen bonds, and the solid line denotes a distance of 3.2 Å between hydride transfer partners C5 and N5. Interactions with the proline carboxylate are identical to those shown for the lactate carboxylate in panel b, and thus are omitted for clarity.
Figure 3
Figure 3
The active site of PutA669. a, Stereo-view of a σA-weighted, simulated annealing, Fo-Fc omit electron density map (2.5 σ) covering the bound L-lactate inhibitor (white). FAD is drawn in yellow. This figure was prepared with Bobscript. b, Stereo-view of the active site with FAD shown in yellow, and amino acid side chains and lactate inhibitor in white. The dotted lines represent hydrogen bonds and ion pairs. Helix α8 is shown in red. c, d, Two orthogonal views of a model of the substrate proline bound to the active site. Proline appears in white with its atom numbered. The dotted lines represent hydrogen bonds, and the solid line denotes a distance of 3.2 Å between hydride transfer partners C5 and N5. Interactions with the proline carboxylate are identical to those shown for the lactate carboxylate in panel b, and thus are omitted for clarity.
Figure 4
Figure 4
The DNA-binding function of PutA669. a, Gel mobility shift analysis of PutA proteins and the put control DNA. PutA261 (0-400 nM), PutA669 (500 nM), and PutA (500 nM each) were added to separate binding mixtures in 70 mM Tris (pH 7.5) containing put control intergenic DNA (20 nM) at 20 °C. Nonspecific ΦX174 ladder DNA (20 μg/ml) was also added to binding mixtures containing 0 nM and 400 nM PutA261. The complexes were separated using an agarose/polyacrylamide (0.5%/3%) native gel at 4 °C. The gel was stained with ethidium bromide to visualize the put DNA-protein complexes and the ΦX174 ladder DNA. b, Comparison of PutA669 domain II (blue) and the HTH three-helix bundle of Cdc6/Cdc18 (yellow, pdb id 1fnn, residues A287-A343). The orientation is identical to that of (Fig. 2b). The dashed curves represent disordered residues in PutA669.
Figure 4
Figure 4
The DNA-binding function of PutA669. a, Gel mobility shift analysis of PutA proteins and the put control DNA. PutA261 (0-400 nM), PutA669 (500 nM), and PutA (500 nM each) were added to separate binding mixtures in 70 mM Tris (pH 7.5) containing put control intergenic DNA (20 nM) at 20 °C. Nonspecific ΦX174 ladder DNA (20 μg/ml) was also added to binding mixtures containing 0 nM and 400 nM PutA261. The complexes were separated using an agarose/polyacrylamide (0.5%/3%) native gel at 4 °C. The gel was stained with ethidium bromide to visualize the put DNA-protein complexes and the ΦX174 ladder DNA. b, Comparison of PutA669 domain II (blue) and the HTH three-helix bundle of Cdc6/Cdc18 (yellow, pdb id 1fnn, residues A287-A343). The orientation is identical to that of (Fig. 2b). The dashed curves represent disordered residues in PutA669.

References

    1. Brown E, Wood JM. Redesigned Purification Yields a Fully functional PutA Protein Dimer from Escherichia coli. J Biol Chem. 1992;267:13086–13092. - PubMed
    1. Menzel R, Roth J. Purification of the putA gene Product. J Biol Chem. 1981;256:9755–9761. - PubMed
    1. Scarpulla RC, Soffer RL. Membrane-Bound Proline Dehydrogenase from Escherichia coli. J Biol Chem. 1978;253:5997–6001. - PubMed
    1. Maloy S, Roth JR. Regulation of Proline Utilization in Salmonella typhimurium: Characterization of put:Mu L(Ap, lac) Operon Fusions. J Bacteriol. 1983;154:561–568. - PMC - PubMed
    1. Menzel R, Roth J. Regulation of genes for Proline Utilization in Salmonella typhimurium: Autogenous Repression by the putA gene Product. J Mol Biol. 1981;148:21–44. - PubMed

Publication types

Associated data

LinkOut - more resources