

No simple dependence between protein evolution rate and the number of protein-protein interactions: only the most prolific interactors tend to evolve slowly
- PMID: 12515583
- PMCID: PMC140311
- DOI: 10.1186/1471-2148-3-1
No simple dependence between protein evolution rate and the number of protein-protein interactions: only the most prolific interactors tend to evolve slowly
Abstract
Background: It has been suggested that rates of protein evolution are influenced, to a great extent, by the proportion of amino acid residues that are directly involved in protein function. In agreement with this hypothesis, recent work has shown a negative correlation between evolutionary rates and the number of protein-protein interactions. However, the extent to which the number of protein-protein interactions influences evolutionary rates remains unclear. Here, we address this question at several different levels of evolutionary relatedness.
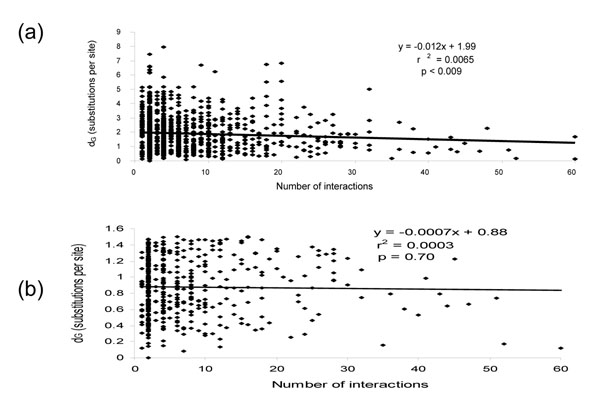
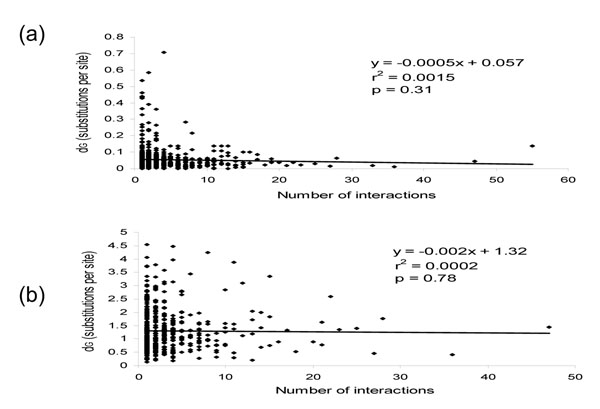
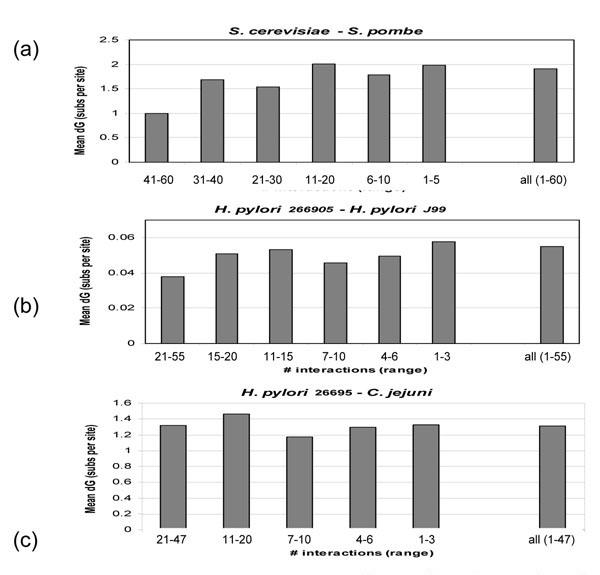
Results: Manually curated data on the number of protein-protein interactions among Saccharomyces cerevisiae proteins was examined for possible correlation with evolutionary rates between S. cerevisiae and Schizosaccharomyces pombe orthologs. Only a very weak negative correlation between the number of interactions and evolutionary rate of a protein was observed. Furthermore, no relationship was found between a more general measure of the evolutionary conservation of S. cerevisiae proteins, based on the taxonomic distribution of their homologs, and the number of protein-protein interactions. However, when the proteins from yeast were assorted into discrete bins according to the number of interactions, it turned out that 6.5% of the proteins with the greatest number of interactions evolved, on average, significantly slower than the rest of the proteins. Comparisons were also performed using protein-protein interaction data obtained with high-throughput analysis of Helicobacter pylori proteins. No convincing relationship between the number of protein-protein interactions and evolutionary rates was detected, either for comparisons of orthologs from two completely sequenced H. pylori strains or for comparisons of H. pylori and Campylobacter jejuni orthologs, even when the proteins were classified into bins by the number of interactions.
Conclusion: The currently available comparative-genomic data do not support the hypothesis that the evolutionary rates of the majority of proteins substantially depend on the number of protein-protein interactions they are involved in. However, a small fraction of yeast proteins with the largest number of interactions (the hubs of the interaction network) tend to evolve slower than the bulk of the proteins.
Figures
References
Publication types
MeSH terms
Substances
LinkOut - more resources
Full Text Sources
Molecular Biology Databases
