

Substructure synthesis method for simulating large molecular complexes
- PMID: 12518058
- PMCID: PMC140894
- DOI: 10.1073/pnas.232588999
Substructure synthesis method for simulating large molecular complexes
Abstract
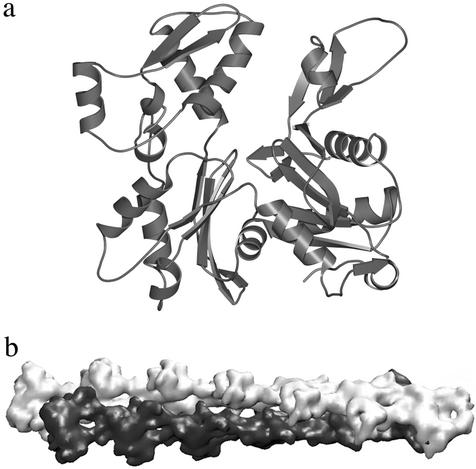
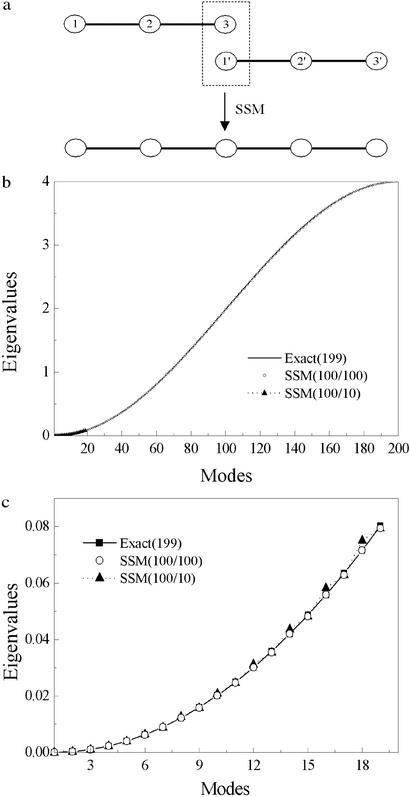
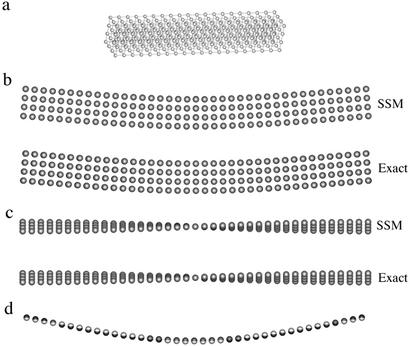
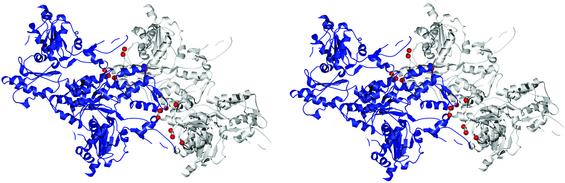
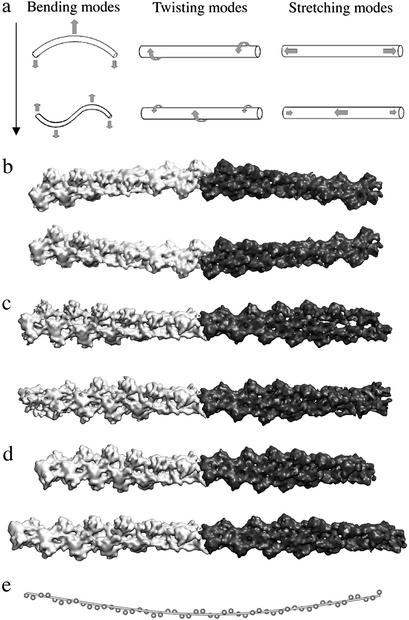
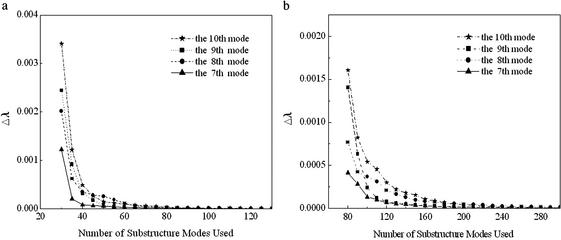
This paper reports a computational method for describing the conformational flexibility of very large biomolecular complexes using a reduced number of degrees of freedom. It is called the substructure synthesis method, and the basic concept is to treat the motions of a given structure as a collection of those of an assemblage of substructures. The choice of substructures is arbitrary and sometimes quite natural, such as domains, subunits, or even large segments of biomolecular complexes. To start, a group of low-frequency substructure modes is determined, for instance by normal mode analysis, to represent the motions of the substructure. Next, a desired number of substructures are joined together by a set of constraints to enforce geometric compatibility at the interface of adjacent substructures, and the modes for the assembled structure can then be synthesized from the substructure modes by applying the Rayleigh-Ritz principle. Such a procedure is computationally much more desirable than solving the full eigenvalue problem for the whole assembled structure. Furthermore, to show the applicability to biomolecular complexes, the method is used to study F-actin, a large filamentous molecular complex involved in many cellular functions. The results demonstrate that the method is capable of studying the motions of very large molecular complexes that are otherwise completely beyond the reach of any conventional methods.
Figures
Similar articles
-
Simulation of F-actin filaments of several microns.Biophys J. 2003 Jul;85(1):27-35. doi: 10.1016/S0006-3495(03)74451-8. Biophys J. 2003. PMID: 12829461 Free PMC article.
-
fSUB: normal mode analysis with flexible substructures.J Phys Chem B. 2012 Jul 26;116(29):8636-45. doi: 10.1021/jp300312u. Epub 2012 Apr 5. J Phys Chem B. 2012. PMID: 22448847 Free PMC article.
-
Virtual interface substructure synthesis method for normal mode analysis of super-large molecular complexes at atomic resolution.J Chem Phys. 2011 Oct 14;135(14):144108. doi: 10.1063/1.3647314. J Chem Phys. 2011. PMID: 22010699
-
Separation of time scale and coupling in the motion governed by the coarse-grained and fine degrees of freedom in a polypeptide backbone.J Chem Phys. 2007 Oct 21;127(15):155103. doi: 10.1063/1.2784200. J Chem Phys. 2007. PMID: 17949219
-
Folding funnels and conformational transitions via hinge-bending motions.Cell Biochem Biophys. 1999;31(2):141-64. doi: 10.1007/BF02738169. Cell Biochem Biophys. 1999. PMID: 10593256 Review.
Cited by
-
Rigid-cluster models of conformational transitions in macromolecular machines and assemblies.Biophys J. 2005 Jul;89(1):43-55. doi: 10.1529/biophysj.104.044347. Epub 2005 Apr 15. Biophys J. 2005. PMID: 15833998 Free PMC article.
-
Simulation of F-actin filaments of several microns.Biophys J. 2003 Jul;85(1):27-35. doi: 10.1016/S0006-3495(03)74451-8. Biophys J. 2003. PMID: 12829461 Free PMC article.
-
Refinement of F-actin model against fiber diffraction data by long-range normal modes.Biophys J. 2004 Jan;86(1 Pt 1):116-24. doi: 10.1016/S0006-3495(04)74089-8. Biophys J. 2004. PMID: 14695255 Free PMC article.
-
fSUB: normal mode analysis with flexible substructures.J Phys Chem B. 2012 Jul 26;116(29):8636-45. doi: 10.1021/jp300312u. Epub 2012 Apr 5. J Phys Chem B. 2012. PMID: 22448847 Free PMC article.
-
COARSE-GRAINED MODELING OF PROTEIN UNFOLDING DYNAMICS.Multiscale Model Simul. 2014;12(1):109-118. doi: 10.1137/130921519. Multiscale Model Simul. 2014. PMID: 25400515 Free PMC article.
References
-
- Brooks C L, III, Karplus M, Pettitt B M. Adv Chem Phys. 1988;71:1–249.
-
- McCammon J A, Harvey S. Dynamics of Proteins and Nucleic Acids. Cambridge, U.K.: Cambridge Univ. Press; 1987.
-
- Brooks B R, Janezic D, Karplus M. J Comput Chem. 1995;16:1522–1542.
-
- Janezic D, Venable R M, Brooks B R. J Comput Chem. 1995;16:1554–1566.
-
- Amadei A, Linssen A B M, Berendsen H J C. Proteins. 1993;17:412–425. - PubMed
Publication types
MeSH terms
Substances
LinkOut - more resources
Full Text Sources
