. 2003 Jan 1;31(1):58-62.
doi: 10.1093/nar/gkg109.

MBGD: microbial genome database for comparative analysis

Affiliations

MBGD: microbial genome database for comparative analysis

Ikuo Uchiyama. Nucleic Acids Res. .

Abstract

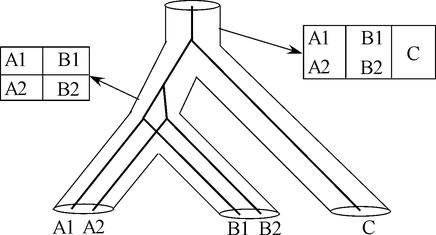
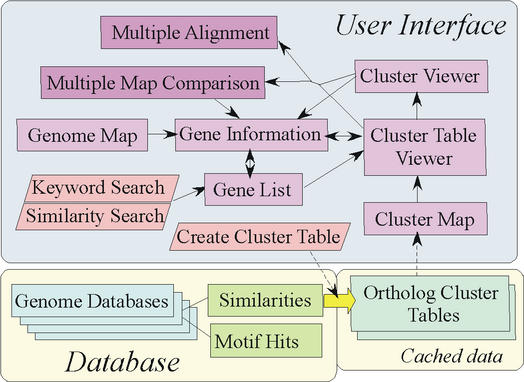
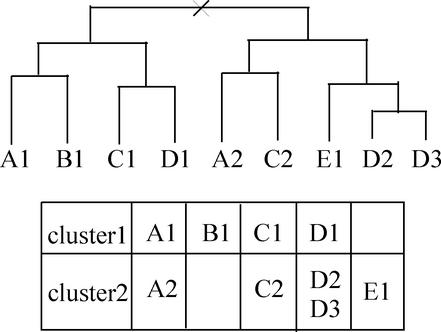
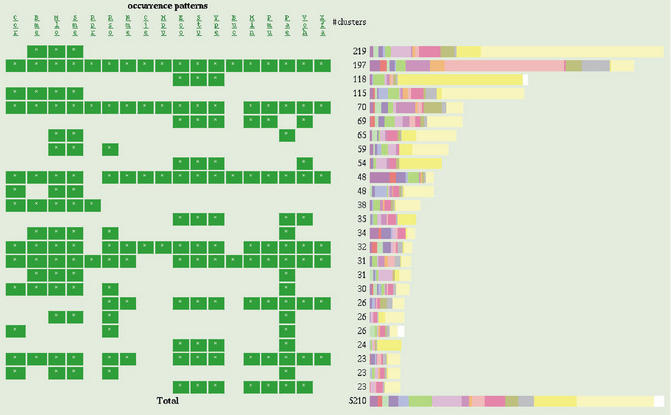
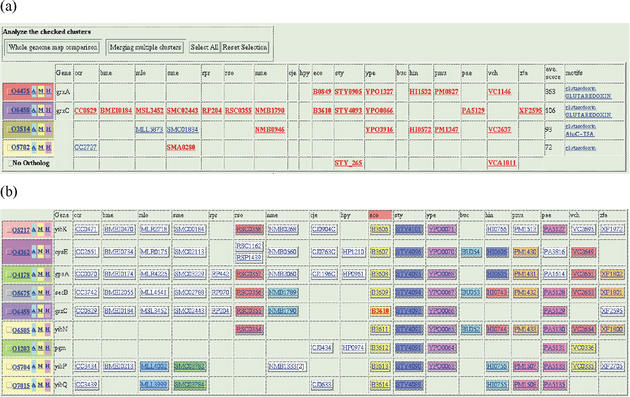
MBGD is a workbench system for comparative analysis of completely sequenced microbial genomes. The central function of MBGD is to create an orthologous gene classification table using precomputed all-against-all similarity relationships among genes in multiple genomes. In MBGD, an automated classification algorithm has been implemented so that users can create their own classification table by specifying a set of organisms and parameters. This feature is especially useful when the user's interest is focused on some taxonomically related organisms. The created classification table is stored into the database and can be explored combining with the data of individual genomes as well as similarity relationships among genomes. Using these data, users can carry out comparative analyses from various points of view, such as phylogenetic pattern analysis, gene order comparison and detailed gene structure comparison. MBGD is accessible at http://mbgd.genome.ad.jp/.


Figures

Figure 1
Figure 1
Ortholog grouping as a mapping from tree structures to a classification table. In this figure, a species tree among three organisms A, B and C is drawn by pipes and a gene tree among five genes A1, A2, B1, B2 and C is drawn by lines. The left table represents an ortholog grouping created from two organisms A and B that contains two ortholog clusters, whereas the right table created from three organisms A, B and C consists of only one ortholog cluster.
Figure 2
Figure 2
Overall architecture of MBGD. Three components (database, cached data created on demand and user interfaces) are separately shown.
Figure 3
Figure 3
Tree splitting procedure for ortholog grouping in MBGD. In this figure, nine genes (A1, B1 etc.) in five organisms (A–E) are classified into two clusters. In this example, the root node is split because three out of four organisms are duplicated in both of the subtrees. The cutoff ratio of duplicated organisms in each root node is a parameter of our algorithm. Note that here we do not consider the species phylogeny in contrast to Figure 1.
Figure 4
Figure 4
Gene cluster map created from 18 organisms belonging to proteobacteria. The left hand side of the figure shows phylogenetic patterns (occurrence patterns in our original terminology), which represent presence (green box) or absence of orthologs in each genome. The bar graph of the right-hand side shows the number of clusters of each phylgenetic pattern, where colors represent function categories. See the web site for explanation of the colors and the abbreviations of organisms' names.
Figure 5
Figure 5
Ortholog cluster tables. Both tables were created from the same 18 proteobacteria as in Figure 4. (a) Ortholog clusters that are homologous to grxA (glutaredoxin 1) orthologs. Four clusters and two singletons (appeared in the ‘No Ortholog’ row) are found and are ordered by average similarity scores shown in the last but one column. Genes that are actually found by similarity searches are written in red boldface. (b) Ortholog clusters that contain genes around B3610 gene on the Escherichia coli genome. Ortholog clusters are ordered according to the gene order of the E.coli genome, and neighboring genes in each genome are assigned the same colors. Note that the same colors in different genomes (columns) have no meaning.

References

    1. Tatusov R.L., Koonin,E.V. and Lipman,D.J. (1997) A genomic perspective on protein families. Science, 278, 631–637. - PubMed
    1. Tatusov R.L., Natale,D.A., Garkavtsev,I.V., Tatusova,T.A., Shankavaram,U.T., Rao,B.S., Kiryutin,B., Galperin,M.Y., Fedorova,N.D. and Koonin,E.V. (2001) The COG database: new developments in phylogenetic classification of proteins from complete genomes. Nucleic Acids Res., 29, 22–28. - PMC - PubMed
    1. Haft D.H., Loftus,B.J., Richardson,D.L., Yang,F., Eisen,J.A., Paulsen,I.T. and White,O. (2001) TIGRFAMS: a protein family resource for the functional identification of proteins. Nucleic Acids Res., 29, 41–43. - PMC - PubMed
    1. Kanehisa M., Goto,S., Kawashima,S. and Nakaya,A. (2002) The KEGG database at GenomeNet. Nucleic Acids Res., 30, 42–46. - PMC - PubMed
    1. Overbeek R., Larsen,N., Pusch,G.D., D'Souza,M., Selkov,E.,Jr, Kyrpides,N., Fonstein,M., Maltsev,N. and Selkov,E. (2000) WIT: integrated system for high-throughput genome sequence analysis and metabolic reconstruction. Nucleic Acids Res., 28, 123–125. - PMC - PubMed

Publication types