

doi: 10.1093/nar/gkg078.
The Stanford Microarray Database: data access and quality assessment tools
Affiliations
- PMID: 12519956
- PMCID: PMC165525
- DOI: 10.1093/nar/gkg078
Item in Clipboard
The Stanford Microarray Database: data access and quality assessment tools
Nucleic Acids Res.
.
Abstract
The Stanford Microarray Database (SMD; http://genome-www.stanford.edu/microarray/) serves as a microarray research database for Stanford investigators and their collaborators. In addition, SMD functions as a resource for the entire scientific community, by making freely available all of its source code and providing full public access to data published by SMD users, along with many tools to explore and analyze those data. SMD currently provides public access to data from 3500 microarrays, including data from 85 publications, and this total is increasing rapidly. In this article, we describe some of SMD's newer tools for accessing public data, assessing data quality and for data analysis.
Figures
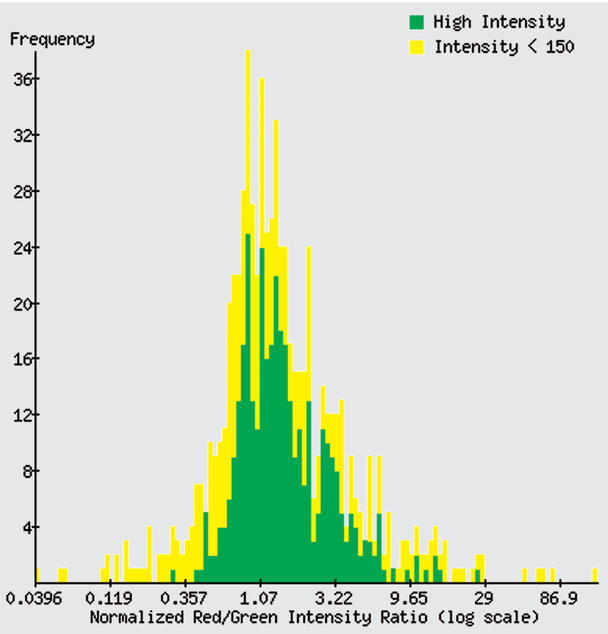
Frequency distribution of ratio results for human clone cDNA image: 461759 (OLR1), from the Expression History tool. Ratios derived from 683 distinct spots, from 863 public arrays on which the clone was printed, are displayed on a log scale (spots ‘flagged’ as unreliable are omitted). Spots that have a high intensity in each channel are more likely to be reliable; these are indicated by the green bars. The yellow bars represent less reliable measurements, with intensity below a threshold value in at least one channel. The user may set the threshold intensity value.
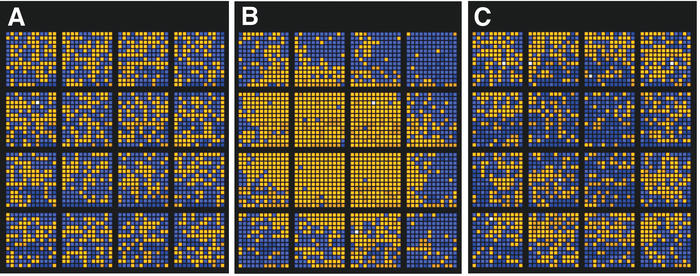
Simplified views of three microarray slides, from the Array Color tool. Spots are shown in topologically correct positions, but not to scale. Sectors (each printed by an individual pin) are distinct blocks of spots. Spots with a ratio of channel 2 (red) intensity to channel 1 (green) intensity of greater than 1.0 are represented by an orange square; spots with ratio less than 1.0 are blue. White spots have a ratio of 1.0. Spots with a low intensity in either channel are slightly darker. The tool allows the user to set the ratio and intensity thresholds and choose raw or normalized data for display. Also presented are ANOVA calculations for dependence of ratio on sector or printing plate, and a mean-variance plot of ratio by sector. Flagged (poorly measured) spots are shown as black and omitted from the ANOVA calculations. (A) This array shows no strong dependence of ratio on sector [F(15, 2471)=2.18, R2=0.01] or printing plate [F(6, 2480)=9.69, R2=0.02]. (B) This array shows a strong dependence of ratio on location [F(15, 2480)=72.52, R2=0.31] and weak to moderate dependence on printing plate [F(15, 2480)=22.48, R2=0.05]. (C) This array shows weak dependence of ratio on sector [F(15, 2464)=5.36, R2=0.03], but somewhat stronger dependence on printing plate [F(6, 2473)=35.56, R2=0.08]. The dependence on printing plate is difficult to pick out by visual inspection alone.
References
-
- Schena M., Shalon,D., Davis,R.W. and Brown,P.O. (1995) Quantitative monitoring of gene expression patterns with a complementary DNA microarray. Science, 270, 467–470. - PubMed
-
- Forozan F., Mahlamaki,E.H., Monni,O., Chen,Y., Veldman,R., Jiang,Y., Gooden,G.C., Ethier,S.P., Kallioniemi,A. and Kallioniemi,O.P. (2000) Comparative genomic hybridization analysis of 38 breast cancer cell lines: a basis for interpreting complementary DNA microarray data. Cancer Res., 60, 4519–4525. - PubMed
-
- Pollack J.R., Perou,C.M., Alizadeh,A.A., Eisen,M.B., Pergamenschikov,A., Williams,C.F., Jeffrey,S.S., Botstein,D. and Brown,P.O. (1999) Genome-wide analysis of DNA copy-number changes using cDNA microarrays. Nature Genet., 23, 41–46. - PubMed
MeSH terms
LinkOut - more resources
Full Text Sources
Other Literature Sources
