

Vibrational spectroscopy of an algal Phot-LOV1 domain probes the molecular changes associated with blue-light reception
- PMID: 12524299
- PMCID: PMC1302627
- DOI: 10.1016/S0006-3495(03)74866-8
Vibrational spectroscopy of an algal Phot-LOV1 domain probes the molecular changes associated with blue-light reception
Abstract
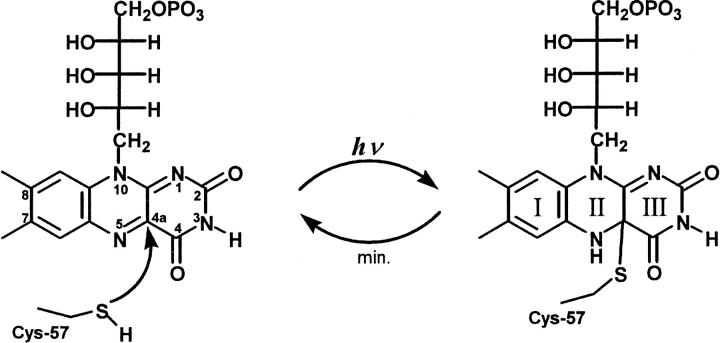
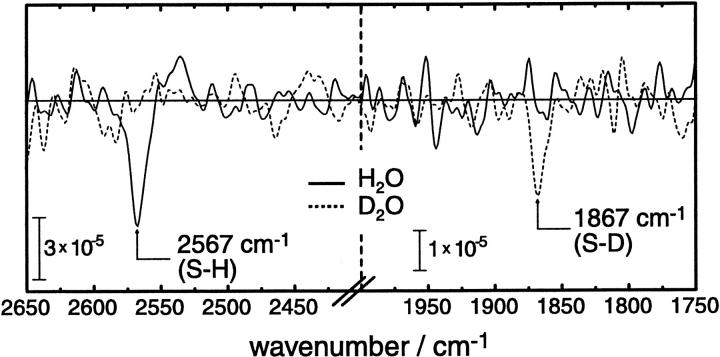
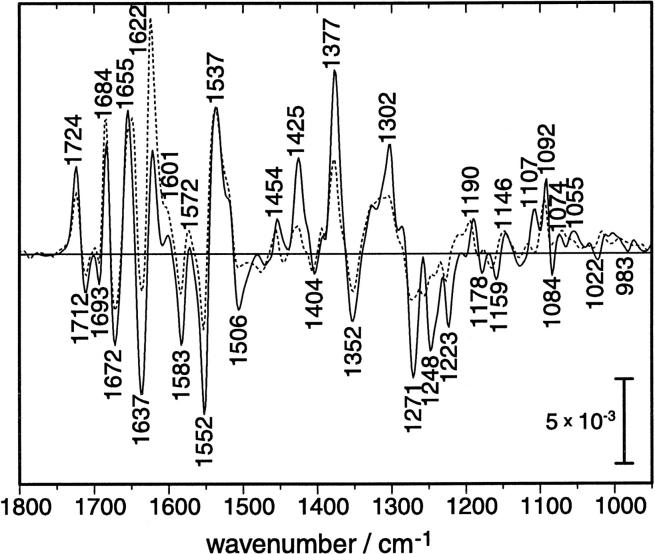
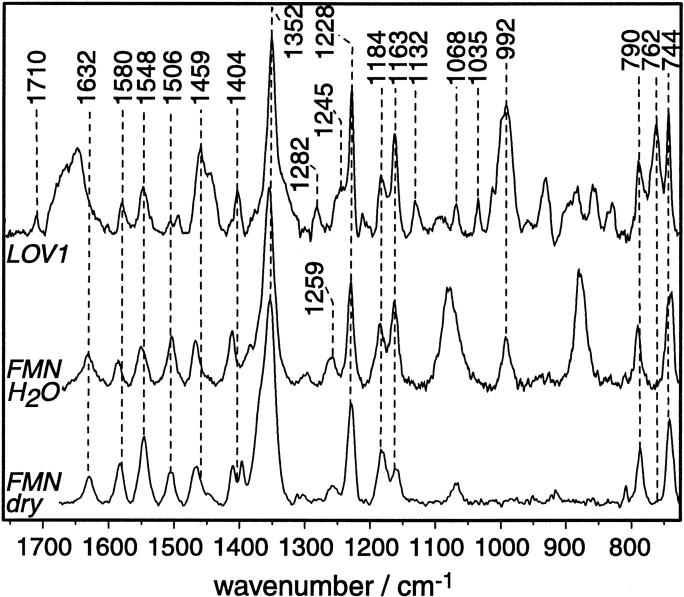
The LOV1 domain of the blue light Phot1-receptor (phototropin homolog) from Chlamydomonas reinhardtii has been studied by vibrational spectroscopy. The FMN modes of the dark state of LOV1 were identified by preresonance Raman spectroscopy and assigned to molecular vibrations. By comparing the blue-light-induced FTIR difference spectrum with the preresonance Raman spectrum, most of the differences are due to FMN modes. Thus, we exclude large backbone changes of the protein that might occur during the phototransformation of the dark state LOV1-447 into the putative signaling state LOV1-390. Still, the presence of smaller amide difference bands cannot be excluded but may be masked by overlapping FMN modes. The band at 2567 cm(-1) is assigned to the S-H stretching vibration of C57, the residue that forms the transient thio-adduct with the chromophore FMN. The occurrence of this band is evidence that C57 is protonated in the dark state of LOV1. This result challenges conclusions from the homologous LOV2 domain from oat that the thiolate of the corresponding cysteine is the reactive species.
Figures

References
-
- Abe, M., and Y. Kyogoku. 1987. Vibrational analysis of flavin derivatives: normal coordinate treatments of lumiflavin. Spectrochimica Acta. A. 43:1027–1037.
-
- Bare, G. H., J. O. Alben, and P. A. Bromberg. 1975. Sulfhydryl groups in hemoglobin. A new molecular probe at the alpha1 beta 1 interface studied by Fourier transform infrared spectroscopy. Biochemistry. 14:1578–1583. - PubMed
-
- Bowman, W. D., and T. G. Spiro. 1981. Normal mode analysis of lumiflavin and interpretation of resonance Raman spectra of flavoproteins. Biochemistry. 20:3313–3318. - PubMed
-
- Briggs, W. R., and J. M. Christie. 2002. Phototropins 1 and 2: versatile plant blue-light receptors. Trends Plant Sci. 7:204–210. - PubMed
Publication types
MeSH terms
Substances
LinkOut - more resources
Full Text Sources
