. 2003 Jan 21;100(2):599-604.
doi: 10.1073/pnas.0234701100. Epub 2003 Jan 10.

Correlated terrestrial and marine evidence for global climate changes before mass extinction at the Cretaceous-Paleogene boundary

Affiliations

Correlated terrestrial and marine evidence for global climate changes before mass extinction at the Cretaceous-Paleogene boundary

Peter Wilf et al. Proc Natl Acad Sci U S A. .

Abstract

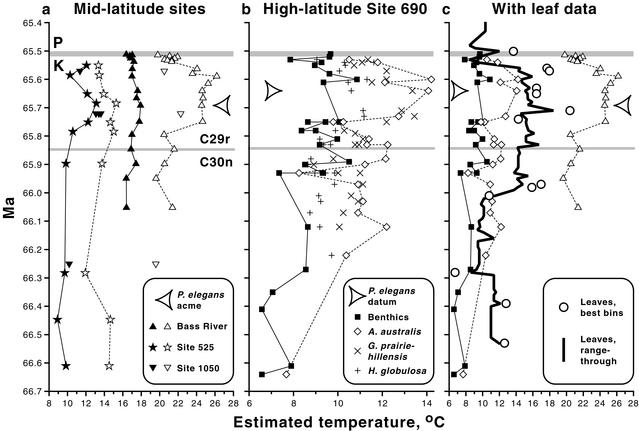
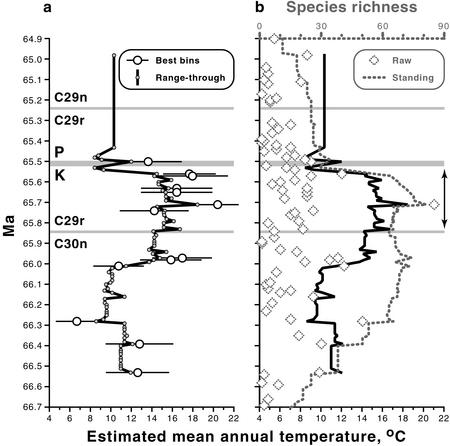
Terrestrial climates near the time of the end-Cretaceous mass extinction are poorly known, limiting understanding of environmentally driven changes in biodiversity that occurred before bolide impact. We estimate paleotemperatures for the last approximately 1.1 million years of the Cretaceous ( approximately 66.6-65.5 million years ago, Ma) by using fossil plants from North Dakota and employ paleomagnetic stratigraphy to correlate the results to foraminiferal paleoclimatic data from four middle- and high-latitude sites. Both plants and foraminifera indicate warming near 66.0 Ma, a warming peak from approximately 65.8 to 65.6 Ma, and cooling near 65.6 Ma, suggesting that these were global climate shifts. The warming peak coincides with the immigration of a thermophilic flora, maximum plant diversity, and the poleward range expansion of thermophilic foraminifera. Plant data indicate the continuation of relatively cool temperatures across the Cretaceous-Paleogene boundary; there is no indication of a major warming immediately after the boundary as previously reported. Our temperature proxies correspond well with recent pCO(2) data from paleosol carbonate, suggesting a coupling of pCO(2) and temperature. To the extent that biodiversity is correlated with temperature, estimates of the severity of end-Cretaceous extinctions that are based on occurrence data from the warming peak are probably inflated, as we illustrate for North Dakota plants. However, our analysis of climate and facies considerations shows that the effects of bolide impact should be regarded as the most significant contributor to these plant extinctions.


Figures

Figure 1
Figure 1
Terminal Cretaceous paleotemperatures estimated from oxygen isotope data from tests of benthic (filled symbols) and planktic (open symbols) foraminifera at middle- (a) and high- (b) latitude drilling sites (see text for references), with the most complete data from a and b plotted against temperatures derived from North Dakota leaves (Fig. 2 and Table 8) (c). Large arrowheads indicate the Bass River size and abundance acme (5), in a, and the Antarctic appearance datum (2), in b, for P. elegans (see text). Paleotemperatures were calculated by using the equation of Erez and Luz (25), assuming an ice-free world with an average δ18O value for ocean water of −1.2 ‰, Peedee belemnite standard (26). Benthic data are based on combined δ18O values for Gavelinella beccariiformis and Nuttallides truempyi, which generally plot within 0.2 ‰ of each other. None of the data has been corrected for variations in seawater salinity or vital effects, and normal marine salinity is assumed for all sites. K = Cretaceous; P = Paleogene; C30n, C29r, C29n = magnetic polarity subchrons 30 normal, 29 reversed, and 29 normal, respectively. Limitations on graphic presentation cause floral data from 20 cm above and foraminiferal data from just below the K–P to appear within the gray line representing the K–P.
Figure 2
Figure 2
Estimated paleotemperatures and floral richness for the terminal Cretaceous and earliest Paleocene in North Dakota (Table 8). (a) Mean annual temperatures based on leaf-margin analyses. Plots show temperatures from 13 1-m bins with at least 20 dicot leaf species each by raw count (maximum = 73 species) and 80 bins with at least 20 dicot leaf species each on a range-through basis (maximum = 92), including single-bin species (see text for details). Error bars denote ±1σ of sampling error or ±2°C, whichever is greater (27). For range-through temperatures, ±2°C is a minimum uncertainty. (b) Species richness per bin as a raw count and on a standing basis exclusive of single-bin species (see text for details), plotted against range-through temperature as in a. Decreases in standing richness below ≈66.2 and above ≈65.2 Ma are partly artifactual as a result of edge effects (see text). Correlation of standing richness and range-through temperature from ≈66.2 to 65.5 Ma: r = 0.605, P = 10−6, computed after detrending both variables by replacing each value with the difference between it and the previous value. Autocorrelations: range-through temperature, r = 0.813; standing richness, r = 0.877. Correlations with time: range-through temperature, r = 0.341, P < 10−2; standing richness, r = 0.488, P = 10−4. Correlation without detrending: r = 0.511, P < 10−4. Arrows denote the range of the “HCIII” flora (18, 19). Abbreviations as in Fig. 1. Limitations on graphic presentation cause floral data from 20 cm above the K–P to appear within the gray line representing the K–P.

References

    1. Stott L D, Kennett J P. Proc Ocean Drill Program Sci Results. 1990;113:829–848.
    1. Huber B T, Watkins D K. Antarct Res Ser. 1992;56:31–60.
    1. Li L Q, Keller G. Geology. 1998;26:995–998.
    1. Barrera E, Savin S M. Geol Soc Am Spec Pap. 1999;332:245–282.
    1. Olsson R K, Wright J D, Miller K G. J Foram Res. 2001;31:275–282.

LinkOut - more resources