Comparative Study
. 2003 Jan;4(1):88-93.
doi: 10.1038/sj.embor.embor711.

Cyclic AMP is sufficient for triggering the exocytic recruitment of aquaporin-2 in renal epithelial cells

Affiliations
Comparative Study

Cyclic AMP is sufficient for triggering the exocytic recruitment of aquaporin-2 in renal epithelial cells

Dorothea Lorenz et al. EMBO Rep. 2003 Jan.

Abstract

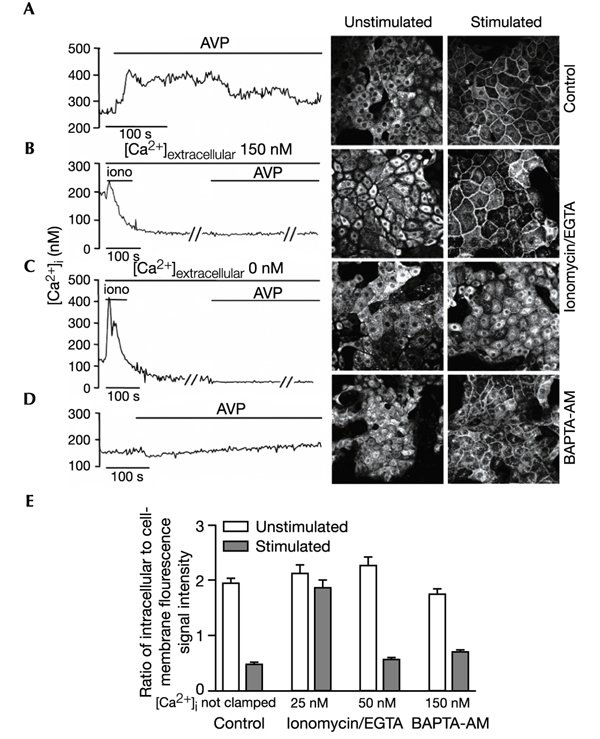
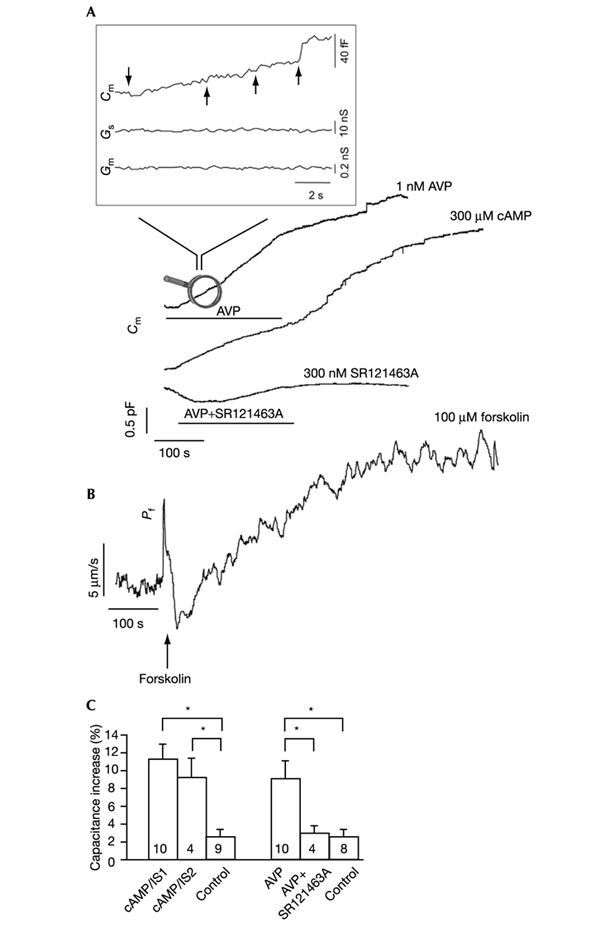
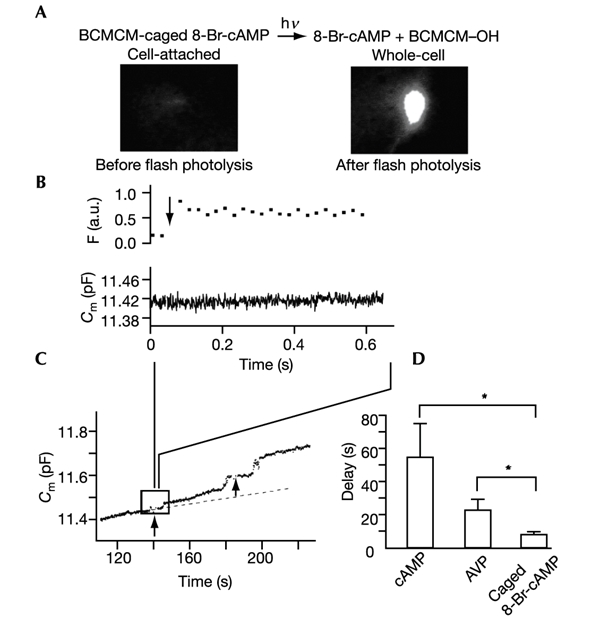
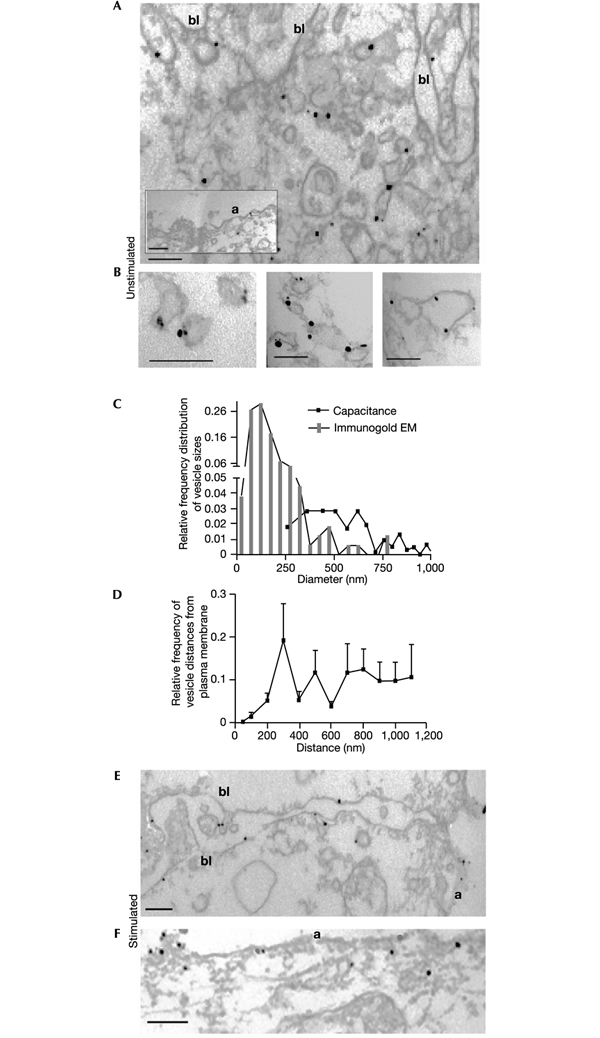
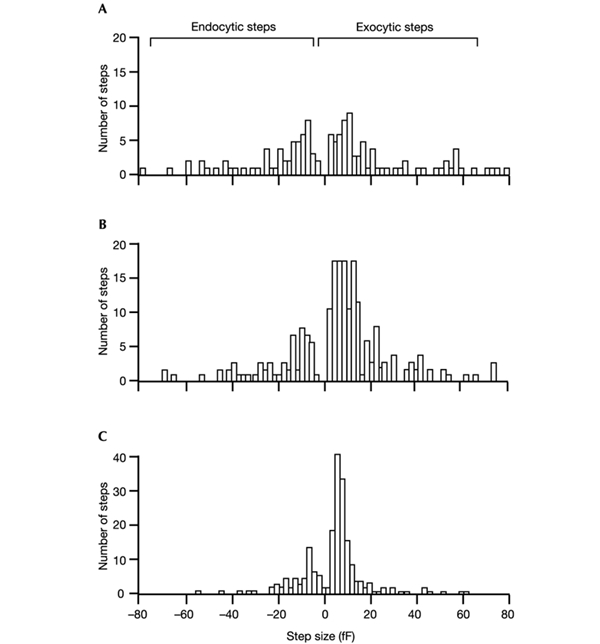
The initial response of renal epithelial cells to the antidiuretic hormone arginine vasopressin (AVP) is an increase in cyclic AMP. By applying immunofluorescence, cell membrane capacitance and transepithelial water flux measurements we show that cAMP alone is sufficient to elicit the antidiuretic cellular response in primary cultured epithelial cells from renal inner medulla, namely the transport of aquaporin-2 (AQP2)-bearing vesicles to, and their subsequent fusion with, the plasma membrane (AQP2 shuttle). The AQP2 shuttle is evoked neither by AVP-independent Ca(2+) increases nor by AVP-induced Ca(2+) increases. However, clamping cytosolic Ca(2+) concentrations below resting levels at 25 nM inhibited exocytosis. Exocytosis was confined to a slow monophasic response, and readily releasable vesicles were missing. Analysis of endocytic capacitance steps revealed that cAMP does not decelerate the retrieval of AQP2 from the plasma membrane. Our data suggest that cAMP initiates an early step, namely the transport of AQP2-bearing vesicles towards the plasma membrane, and do not support a regulatory function for Ca(2+) in the AQP2 shuttle.


Figures

Figure 1
Figure 1
Effect of [Ca2+]i in IMCD cells (left) on the AQP2 shuttle (centre and right) induced by 100 nM AVP. (A) AQP2 redistribution from intracellular vesicles to the plasma membrane without buffering of [Ca2+]i. (B, C) [Ca2+]i was clamped by incubation of cells for 11 min in hypertonic DMEM medium containing 3.7 mM EGTA and 1.8 mM CaCl2 (B) or 2 mM EGTA without CaCl2 (C). During the first minute, the cells were incubated with ionomycin (iono; 10 μM) for equilibration of [Ca2+]i with the extracellular medium. After an initial release of Ca2+ from intracellular stores, [Ca2+]i reached steady state. (D) [Ca2+]i was clamped to resting values (150 nM) by cell treatment for 30 min with 50 μM BAPTA-AM. (E) Ratios of intracellular to cell-membrane fluorescence (more than 1 and less than 1 indicate a predominantly intracellular and a plasma-membrane localization of AQP2, respectively).
Figure 2
Figure 2
Dynamics of changes in Cm and Pf. (A) Cm records of IMCD cells (whole-cell configuration) exposed to 1 nM AVP, 300 μM cAMP or 1 nM AVP plus 300 nM SR121463A (V2R antagonist). AVP and SR121463A were pressure-ejected (0.4 μl s−1) from an application pipette at ∼100 μm distance from the cell. cAMP was dialysed through the patch pipette. Box, expanded Cm, electrical cell membrane (Gm) and series (Gs) conductance traces (arrows indicate detectable Cm steps). (B) Pf time course of the IMCD cell monolayer stimulated with 100 μM forskolin. (C) Summarized results of increases in Cm 400 s after stimulation. Pipette solution IS1 had low Ca2+-buffering capacity; pipette solution IS2 was clamped to 40 nM free Ca2+. Numbers in the columns are numbers of cells; error bars show s.e.m. Asterisk indicates P < 0.005 (t-test).
Figure 3
Figure 3
Osmotic water-flux-induced steady-state K+ dilution allowed the calculation of Pf. (A) Resting cells (Pf = 12 μm s−1) were stimulated with 50 μM forskolin (26 μm s−1). Addition of 50 μM BAPTA-AM did not significantly alter water permeability. (B) Pf of the resting monolayer (16 μm s−1) was not significantly altered by 50 μM BAPTA-AM. Subsequent stimulation with 50 μM forskolin resulted in an increase in Pf to 32 μm s−1, which was reversed to 12 μm s−1 by 30 μM H89.
Figure 4
Figure 4
Cm recordings after flash photolysis of intracellularly applied BCMCM-caged 8-Br-cAMP (500 μM). (A) Visualization of the photoproduct fluorescence in living IMCD cells before (left) and after (right) flash-induced photolysis (excitation at 347 nm for 0.3 s; emission at more than 400 nm). (B) High-time-resolution recordings of fluorescence F (a.u., arbitrary units; 10 ms excitations) and Cm (794 Hz) before and after the first flash. (C) Low-time-resolution recordings from the same cell. The dotted line shows the baseline before the flash; arrows indicate flash delivery. (D) Time delays between stimulation and the onset of exocytosis for different stimuli; error bars show s.e.m. Asterisk indicates P < 0.05 (t-test).
Figure 5
Figure 5
Localization of AQP2 by immunogold EM. (A) AQP2-bearing vesicles in resting cells. Apical (a) and basolateral (bl) plasma membranes show no gold labelling. (B) Single vesicles at higher magnification (scale bar, 200 nm). (C) Size distribution of gold-labelled vesicles compared with the vesicle sizes derived from Cm steps (more than 280 nm). (D) Relative frequency of AQP2-bearing vesicles as a function of the distance from the plasma membrane (eight cells). The vesicles were sorted into 100-nm bins. The first bin was subdivided into two bins of 50 nm. (E, F) After stimulation with forskolin (100 μM, 30 min), AQP2 is localized predominantly at the plasma membrane (a and bl). Control cells, incubated (1) without primary antibody, (2) with normal goat serum instead of primary antibody and (3) with gold-labelled BSA instead of secondary antibody revealed no staining (not shown).
Figure 6
Figure 6
Frequency distribution of the sizes of exocytic and endocytic events (histogram bin size 2 fF). Resolvable Cm steps (more than 2.5 fF) accounting for ∼23% of the increase in Cm, were analysed (Hartmann et al., 1995) in unstimulated (A), cAMPstimulated (B) and AVP-stimulated (C) cells. The probability that a detected step was a false positive was less than 0.002.

References

    1. Agre P., Nielsen S. & Knepper M.A. (2000) in The Kidney. Physiology and Pathophysiology (ed. Seldin, D.W. & Giebisch, G.) 363–377. Lippincott Williams & Wilkins, Philadelphia.
    1. Chou C.L. et al. . (2000) Regulation of aquaporin-2 trafficking by vasopressin in the renal collecting duct—roles of ryanodinesensitive Ca2+ stores and calmodulin. J. Biol. Chem., 275, 36839–36846. - PubMed
    1. Deen P.M.T. et al. . (1994) Requirement of human renal water channel aquaporin-2 for vasopressin-dependent concentration of urine. Science, 264, 92–95. - PubMed
    1. Hacker G.W. et al. . (1988) Silver acetate autometallography: an alternative enhancement technique for immunogoldsilver staining (IGSS) and silver amplification of gold, silver, mercury, and zinc in tissues. J. Histotechnol., 11, 213–221.
    1. Hagen V. et al. . (2001) Highly efficient and ultrafast phototriggers for cAMP and cGMP by using long-wavelength UV/VIS-activation. Angew. Chem. Int. Ed., 40, 1045–1048. - PubMed

Publication types

MeSH terms