. 2003 Feb;77(3):2195-206.
doi: 10.1128/jvi.77.3.2195-2206.2003.

The E6 and E7 proteins of the cutaneous human papillomavirus type 38 display transforming properties

Affiliations

The E6 and E7 proteins of the cutaneous human papillomavirus type 38 display transforming properties

Sandra Caldeira et al. J Virol. 2003 Feb.

Abstract

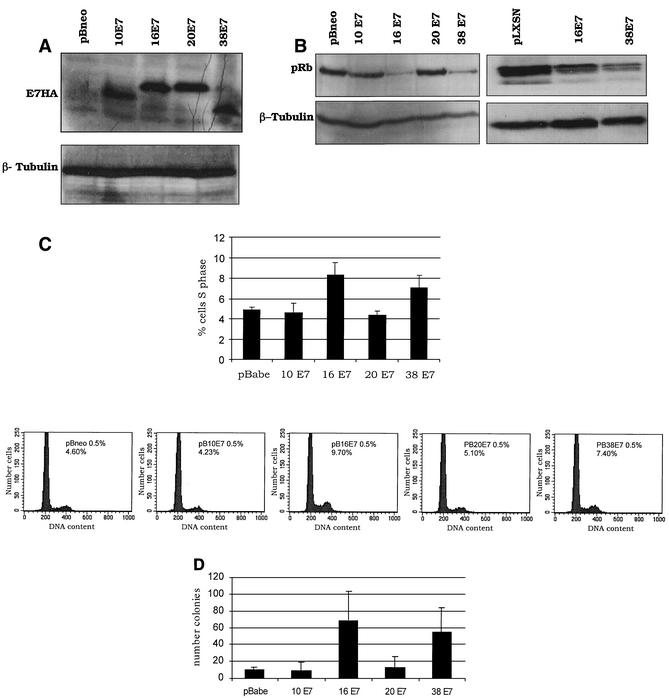
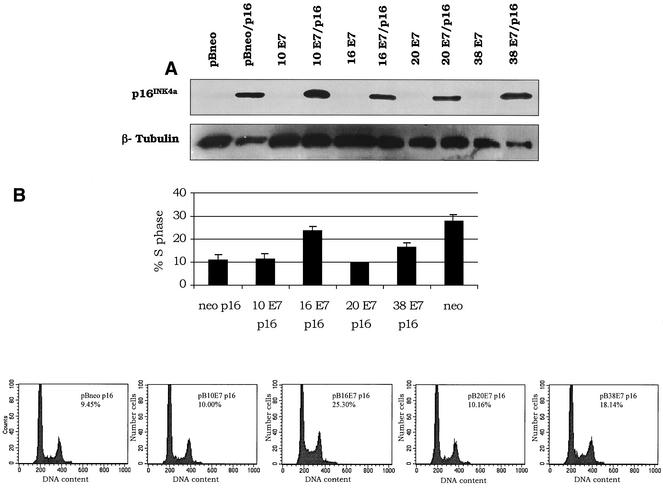
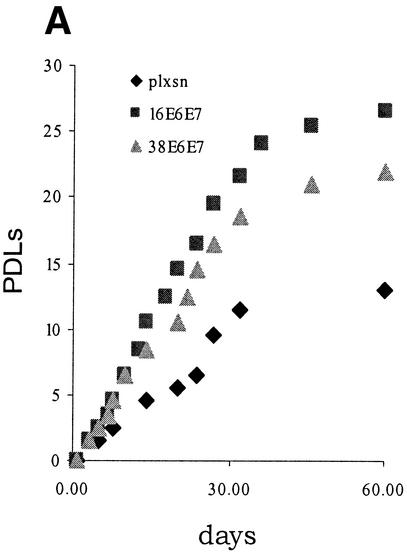
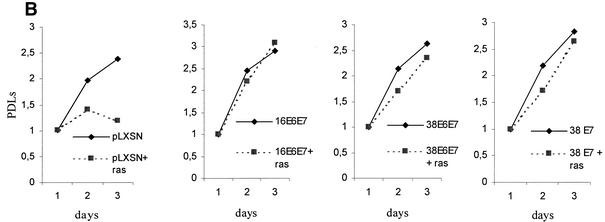
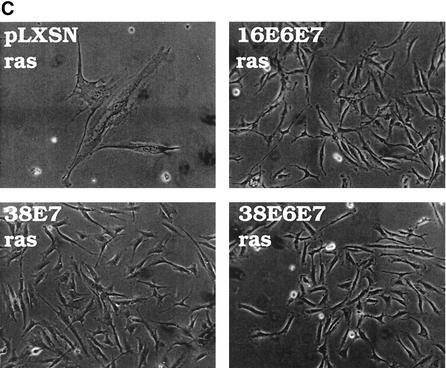
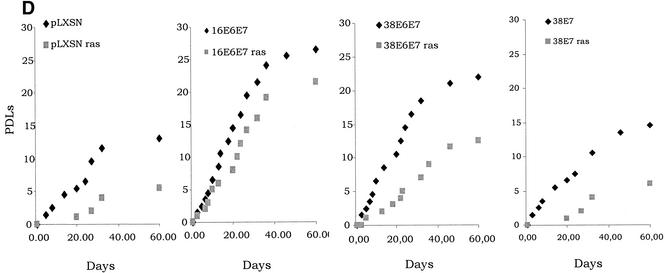
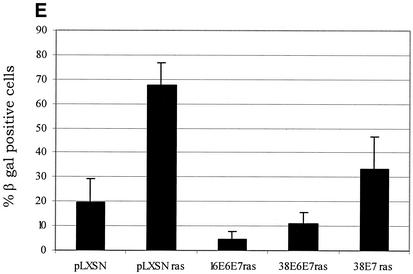
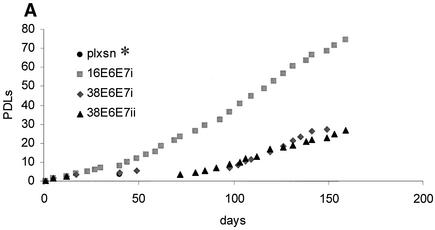
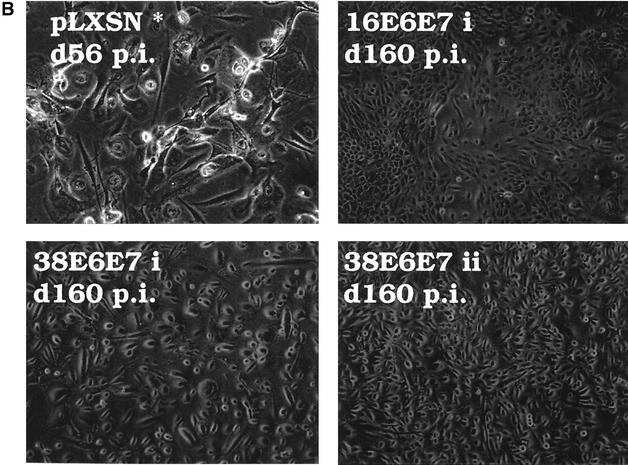
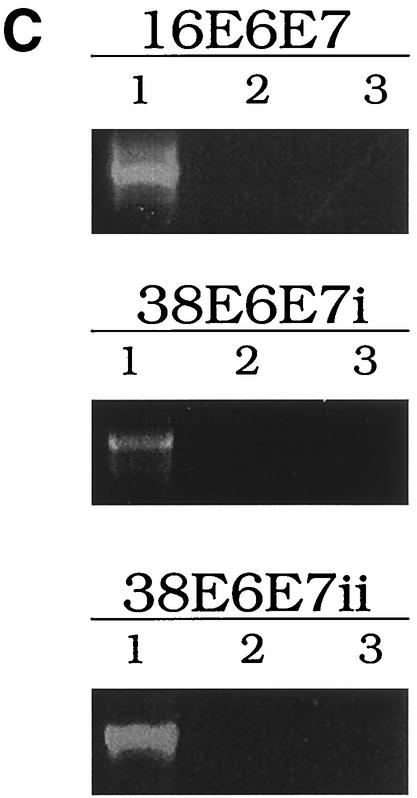
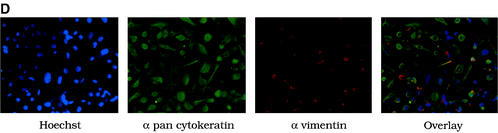
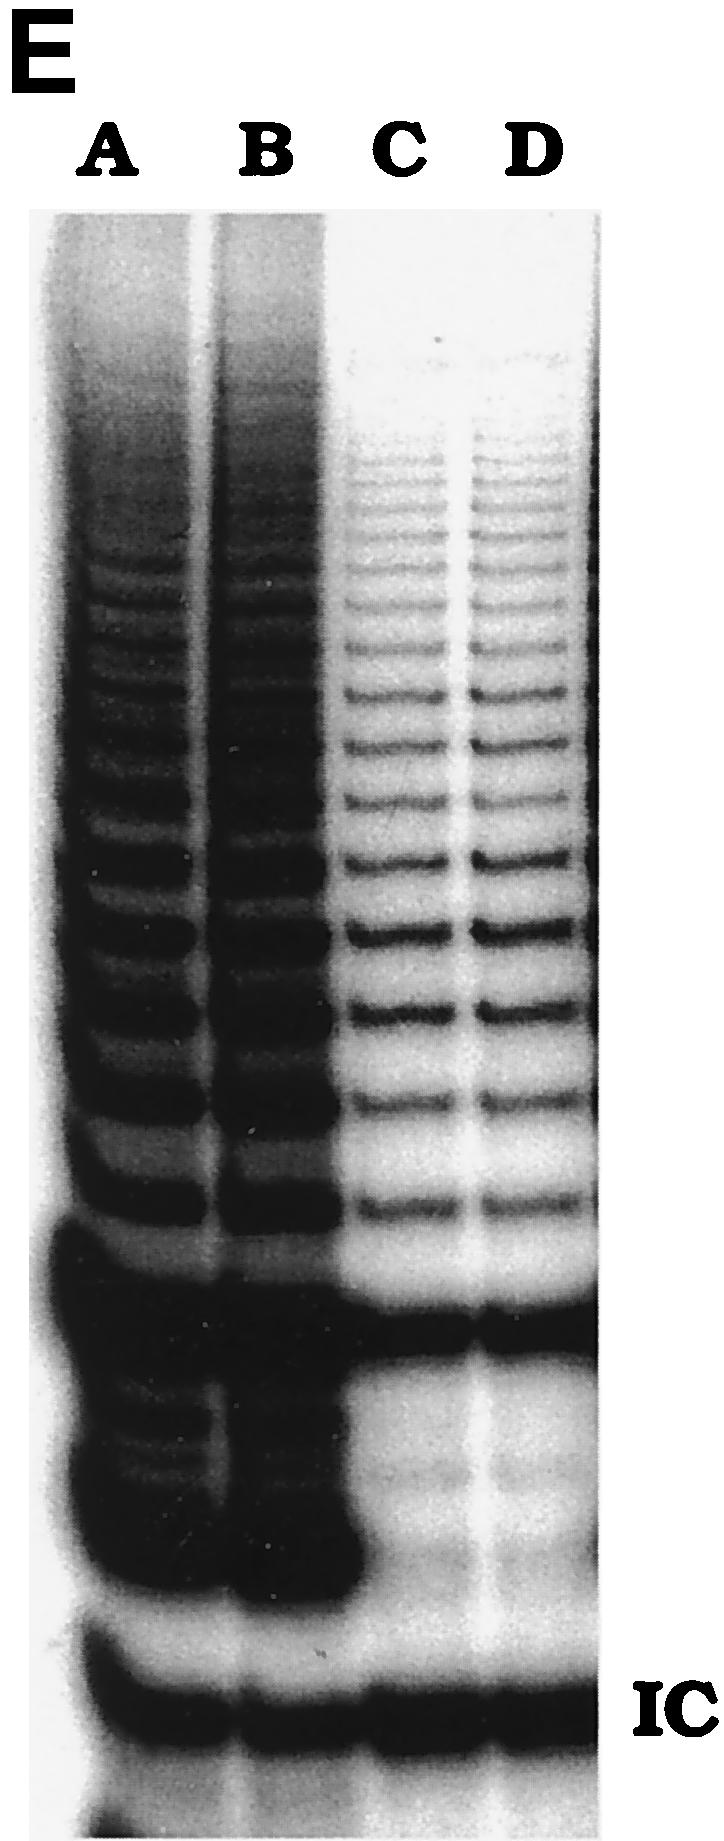
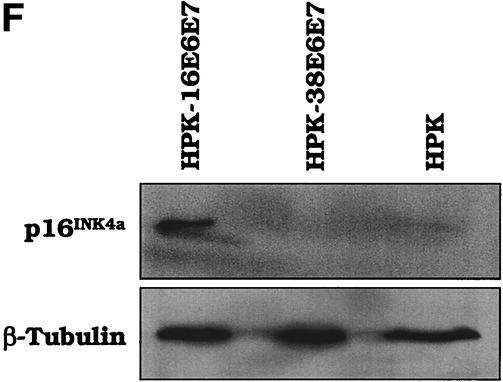
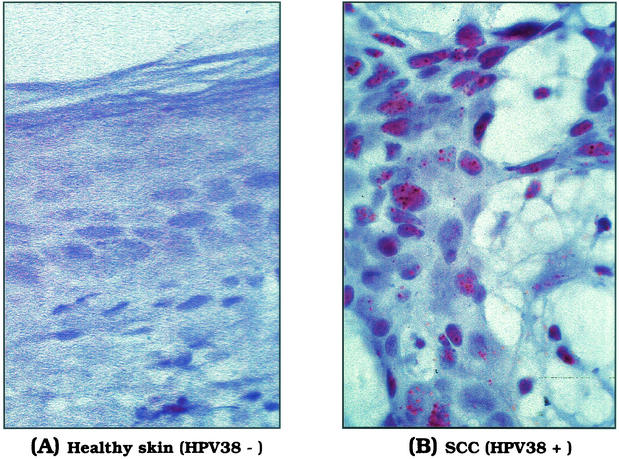
Several studies have suggested the involvement of cutaneous human papillomaviruses (HPVs) in the development of nonmelanoma skin cancers. Here we have characterized the in vitro properties of E7 proteins of three cutaneous HPV types, 10, 20, and 38, which are frequently detected in skin specimens. We show that HPV38 E7 is able to inactivate the tumor suppressor pRb and induces loss of G(1)/S transition control, a key event in carcinogenesis. In contrast, HPV10 and HPV20 E7 proteins do not display these in vitro transforming activities. We also show that the two early proteins E6 and E7 of HPV38 are sufficient to corrupt the cell cycle and senescence programs in primary cells, inducing active and long-lasting proliferation of primary human keratinocytes, the natural host cells. Our study shows that E6 and E7 of this cutaneous HPV type have transforming activity in primary human cells, suggesting a role for HPV38 infection in skin carcinogenesis. In further support of such a role, we detected HPV38 DNA in approximately 50% of nonmelanoma skin cancers, but only in 10% of healthy skin specimens (P < 0.001).


Figures

FIG. 1.
FIG. 1.
In vitro ability of E7 protein from HPV types 10, 20, and 38 to associate with pRb. (A) Quantification of GST fusion proteins. The different GST-E7 fusion proteins were purified as described previously (1). Five microliters of fusion proteins immobilized on glutathione beads was applied to a polyacrylamide-sodium dodecyl sulfate gel and stained with Coomassie brilliant blue R-250 to estimate the protein concentration. (B) GST pulldown assay. HaCaT cellular extracts (600 μg) were incubated with beads containing approximately 1 μg of the different fusion proteins. After extensive washing of the beads, the amount of pRb associated with the different GST-E7 proteins was determined by immunoblot analysis with a specific anti-pRb antibody (14001A; Pharmingen). One-tenth of the total cellular extract (60 μg) used in the GST pulldown assay (input) was applied to a polyacrylamide-sodium dodecyl sulfate gel. GST, GST16E6, and GST16E7G24 (a mutant form of 16E7 that does not efficiently associate with pRb) were used as negative controls.
FIG. 2.
FIG. 2.
In vitro biological properties of E7 protein from HPV types 10, 20, and 38. (A) Expression of E7 proteins in NIH 3T3 cells. One hundred micrograms of protein extract was fractionated on a 12% polyacrylamide-sodium dodecyl sulfate gel, transferred to a polyvinylidene difluoride membrane, and incubated with an anti-HA-tag monoclonal antibody (MMS-101R; Babco) or a monoclonal anti-β-tubulin antibody (TUB2.1; Sigma). (B) Levels of pRb in NIH 3T3 (left panel) or primary human fibroblast (right panel) cells expressing the different E7 proteins. One hundred micrograms of protein extracts of cells expressing the different oncoproteins as indicated was applied to an 8% polyacrylamide-sodium dodecyl sulfate gel, transferred to a polyvinylidene difluoride membrane, and incubated with an anti-pRb (14001A; Pharmingen) or β-tubulin (TUB2.1; Sigma) antibody. (C) Ability of E7 proteins to stimulate S-phase entry in serum-deprived NIH 3T3 cells. Mock-infected NIH 3T3 cells (infected with empty retrovirus) or infected NIH 3T3 cells expressing the E7 proteins, as indicated in the figure, were grown in DMEM with 0.5% calf serum for 48 h. The percentage of the population in S phase was determined by flow cytometry. The results are averages of five independent experiments, and differences were statistically significant (pBabe versus HPV16 E7, P = 0.013; pBabe versus HPV38 E7, P = 0.010). The cell cycle profiles of a representative experiment are also shown (bottom panels). (D) Efficiency of the E7 proteins in inducing anchorage-independent growth. The results are averages of three independent experiments, each performed in duplicate. The difference between the values of HPV16 E7 or HPV38 E7 cells and control cells (pBabe) was statistically significant (pBabe versus HPV16 E7, P = 0.0001; pBabe versus HPV38 E7, P = 0.0004).
FIG. 3.
FIG. 3.
Induction of S phase by E7 proteins in the presence of high levels of p16INK4a. (A) Expression of human p16INK4a in NIH 3T3 cells. One hundred micrograms of protein extracts of cells infected with different recombinant retroviruses (viral genes/p16INK4a) as indicated was applied to a 15% polyacrylamide-sodium dodecyl sulfate gel, transferred onto a polyvinylidene difluoride membrane, and incubated with an anti-human p16INK4a or β-tubulin (TUB2.1; Sigma) antibody. (B) Ability of E7 proteins to stimulate S-phase entry in p16INK4a-expressing NIH 3T3 cells. Double-infected cells were harvested, fixed, and stained with propidium iodide after neomycin and puromycin selection. The cell cycle profile was analyzed by flow cytometry. The data represent the means of four independent experiments. The difference between the values of HPV16 E7 or HPV38 E7 cells and control cells (pBabe) was statistically significant (pBabe versus HPV16 E7, P = 0.03; pBabe versus HPV38 E7, P = 0.03). The cell cycle profiles of a representative experiment are also shown (bottom panels).
FIG. 4.
FIG. 4.
Activity of HPV38 E6 and E7 in primary human fibroblasts. (A) Long-term analysis of the growth profile of primary human fibroblasts expressing the HPV proteins. The graph represents the number of population doublings (PDL) at the indicated times. PDL 0 refers to the point at which drug selection was complete after infection with the different recombinant retroviruses. (B) Growth time course of the different cultures. After selection, growth was followed daily for 3 days by measuring the cellular protein content of cell cultures as previously described (46). The data are the means of two independent experiments, each performed in triplicate. (C) Morphology of primary human fibroblasts expressing the HPV proteins and the ras oncogene. The different cell lines (as indicated in the figure) were photographed at day 5 postselection. The same magnification was used (10×) in all the photomicrographs. (D) Long-term analysis of the growth profile of primary human fibroblasts expressing the HPV genes and ras. The graph represents the number of population doublings (PDL) at the indicated times. PDL 0 refers to the point at which drug selection was complete after retroviral infection. (E) Detection of senescent cells in the different cultures by β-galactosidase staining. Primary human oral fibroblasts were stained for β-galactosidase (pH 6) at day 30 postselection. Ten independent fields of at least 100 cells each were counted, and the percentage of stained blue cells was calculated.
FIG. 4.
FIG. 4.
Activity of HPV38 E6 and E7 in primary human fibroblasts. (A) Long-term analysis of the growth profile of primary human fibroblasts expressing the HPV proteins. The graph represents the number of population doublings (PDL) at the indicated times. PDL 0 refers to the point at which drug selection was complete after infection with the different recombinant retroviruses. (B) Growth time course of the different cultures. After selection, growth was followed daily for 3 days by measuring the cellular protein content of cell cultures as previously described (46). The data are the means of two independent experiments, each performed in triplicate. (C) Morphology of primary human fibroblasts expressing the HPV proteins and the ras oncogene. The different cell lines (as indicated in the figure) were photographed at day 5 postselection. The same magnification was used (10×) in all the photomicrographs. (D) Long-term analysis of the growth profile of primary human fibroblasts expressing the HPV genes and ras. The graph represents the number of population doublings (PDL) at the indicated times. PDL 0 refers to the point at which drug selection was complete after retroviral infection. (E) Detection of senescent cells in the different cultures by β-galactosidase staining. Primary human oral fibroblasts were stained for β-galactosidase (pH 6) at day 30 postselection. Ten independent fields of at least 100 cells each were counted, and the percentage of stained blue cells was calculated.
FIG. 5.
FIG. 5.
HPV38 E6 and E7 increase the life span of primary human keratinocytes. (A) Long-term analysis of the growth profile of primary human keratinocytes. The graph represents the number of population doublings (PDL) at the indicated times. PDL 0 refers to the point at which drug selection was complete after retroviral infection. After 60 days, pLXSN∗ cultures (infected with empty vector retrovirus) did not contain any viable keratinocytes. (B) Morphology of primary human keratinocytes expressing E6 and E7 of HPV16 or HPV38. The different cell cultures (as indicated in the figure) were photographed at the indicated times postinfection. After 60 days, pLXSN∗ cultures (infected with empty vector retrovirus) did not contain any viable keratinocytes. HPV38 E6/E7 keratinocytes i and ii are different cultures which were obtained in two independent experiments. (C) Determination of mRNA levels of E6 and E7 by RT-PCR. Total RNA and cDNA were prepared as described in Materials and Methods. The cDNA obtained was used as the template for PCR (lane 1). As a negative control, a PCR was performed omitting the reverse transcriptase step (lane 2) or with water as the template (lane 3). (D) Immunofluorescence of HPV38 E6/E7 keratinocytes. Cells were fixed and double stained with the pankeratin antibody (Dako; green) and the vimentin antibody (Progen; red), which stain keratinocytes and fibroblasts, respectively. DNA was stained with Hoechst 33342 blue. (E) Telomerase activity in primary human keratinocytes expressing E6 and E7 of HPV16 or HPV38. All the assays were performed in duplicate. IC, internal control (36-bp standard), which is provided in the TRAPeze kit (Intergen Company, Oxford, United Kingdom). (F) Determination of p16INK4a levels in human keratinocytes expressing the viral proteins. One hundred micrograms of protein extracts of the cell cultures indicated in the figure was applied to a 15% polyacrylamide-sodium dodecyl sulfate gel, transferred to a polyvinylidene difluoride membrane, and incubated with an anti-human p16INK4a or β-tubulin (TUB2.1; Sigma) antibody.
FIG. 5.
FIG. 5.
HPV38 E6 and E7 increase the life span of primary human keratinocytes. (A) Long-term analysis of the growth profile of primary human keratinocytes. The graph represents the number of population doublings (PDL) at the indicated times. PDL 0 refers to the point at which drug selection was complete after retroviral infection. After 60 days, pLXSN∗ cultures (infected with empty vector retrovirus) did not contain any viable keratinocytes. (B) Morphology of primary human keratinocytes expressing E6 and E7 of HPV16 or HPV38. The different cell cultures (as indicated in the figure) were photographed at the indicated times postinfection. After 60 days, pLXSN∗ cultures (infected with empty vector retrovirus) did not contain any viable keratinocytes. HPV38 E6/E7 keratinocytes i and ii are different cultures which were obtained in two independent experiments. (C) Determination of mRNA levels of E6 and E7 by RT-PCR. Total RNA and cDNA were prepared as described in Materials and Methods. The cDNA obtained was used as the template for PCR (lane 1). As a negative control, a PCR was performed omitting the reverse transcriptase step (lane 2) or with water as the template (lane 3). (D) Immunofluorescence of HPV38 E6/E7 keratinocytes. Cells were fixed and double stained with the pankeratin antibody (Dako; green) and the vimentin antibody (Progen; red), which stain keratinocytes and fibroblasts, respectively. DNA was stained with Hoechst 33342 blue. (E) Telomerase activity in primary human keratinocytes expressing E6 and E7 of HPV16 or HPV38. All the assays were performed in duplicate. IC, internal control (36-bp standard), which is provided in the TRAPeze kit (Intergen Company, Oxford, United Kingdom). (F) Determination of p16INK4a levels in human keratinocytes expressing the viral proteins. One hundred micrograms of protein extracts of the cell cultures indicated in the figure was applied to a 15% polyacrylamide-sodium dodecyl sulfate gel, transferred to a polyvinylidene difluoride membrane, and incubated with an anti-human p16INK4a or β-tubulin (TUB2.1; Sigma) antibody.
FIG. 6.
FIG. 6.
Detection of HPV38 DNA in skin lesions by in situ hybridization. In situ hybridization was performed with a genomic DNA probe of HPV38. The micrographs show an HPV38-negative healthy skin specimen (A) and a squamous cell carcinoma containing HPV38 DNA (B). Positive signals are seen as punctate, brown precipitates in almost all nuclei of the tumor tissue. Original magnification, ×60.

References

    1. Alunni-Fabbroni, M., T. Littlewood, L. Deleu, S. Caldeira, M. Giarre, M. Dell' Orco, and M. Tommasino. 2000. Induction of S phase and apoptosis by the human papillomavirus type 16 E7 protein are separable events in immortalized rodent fibroblasts. Oncogene 19:2277-2285. - PubMed
    1. Ananthaswamy, H. N., S. M. Loughlin, P. Cox, R. L. Evans, S. E. Ullrich, and M. L. Kripke. 1997. Sunlight and skin cancer: inhibition of p53 mutations in UV-irradiated mouse skin by sunscreens. Nat. Med. 3:510-514. - PubMed
    1. Ananthaswamy, H. N., and W. E. Pierceall. 1992. Molecular alterations in human skin tumors. Prog. Clin. Biol. Res. 376:61-84. - PubMed
    1. Armstrong, B. K., and A. Kricker. 2001. The epidemiology of UV induced skin cancer. J. Photochem. Photobiol. B 63:8-18. - PubMed
    1. Astori, G., D. Lavergne, C. Benton, B. Hockmayr, K. Egawa, C. Garbe, and E. M. de Villiers. 1998. Human papillomaviruses are commonly found in normal skin of immunocompetent hosts. J. Investig. Dermatol. 110:752-755. - PubMed

Publication types

Substances