. 2003 Jan 15;546(Pt 2):403-13.
doi: 10.1113/jphysiol.2002.030460.

Effect of androgen deficiency on mouse ventricular repolarization

Affiliations

Effect of androgen deficiency on mouse ventricular repolarization

Judith Brouillette et al. J Physiol. .

Abstract

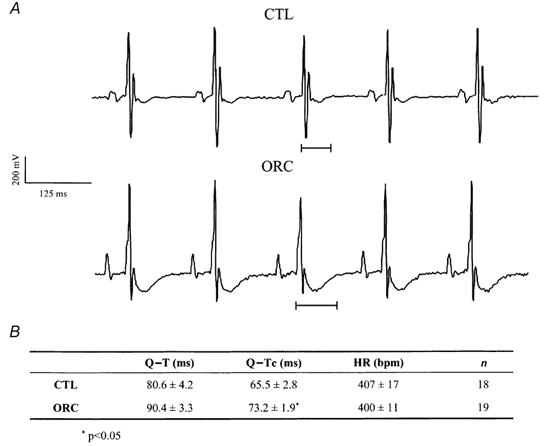
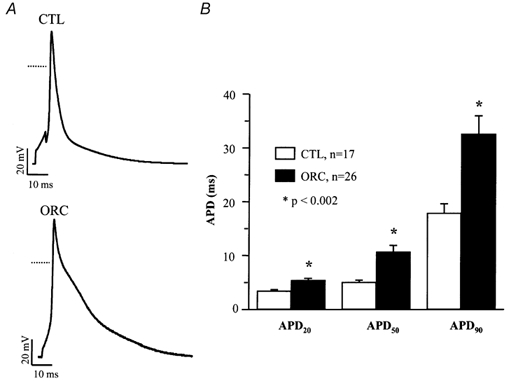
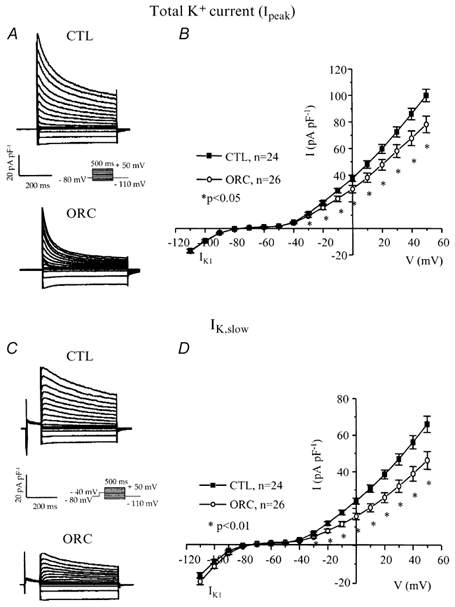
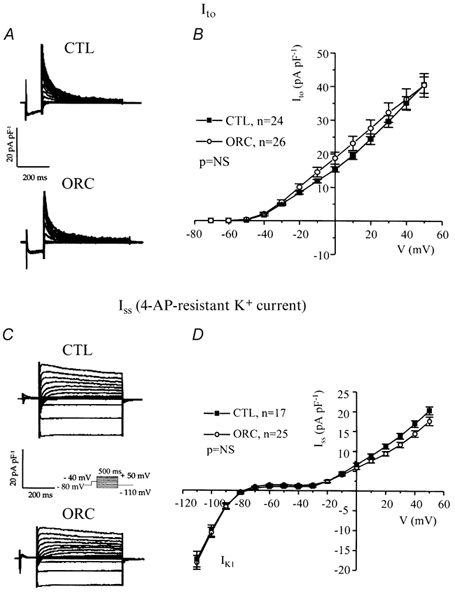
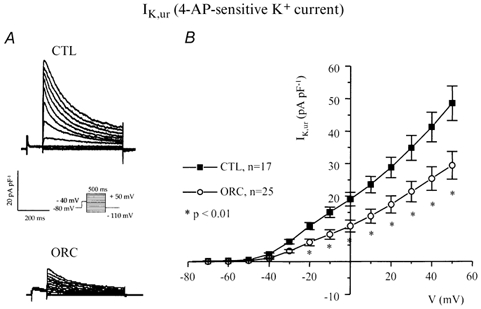
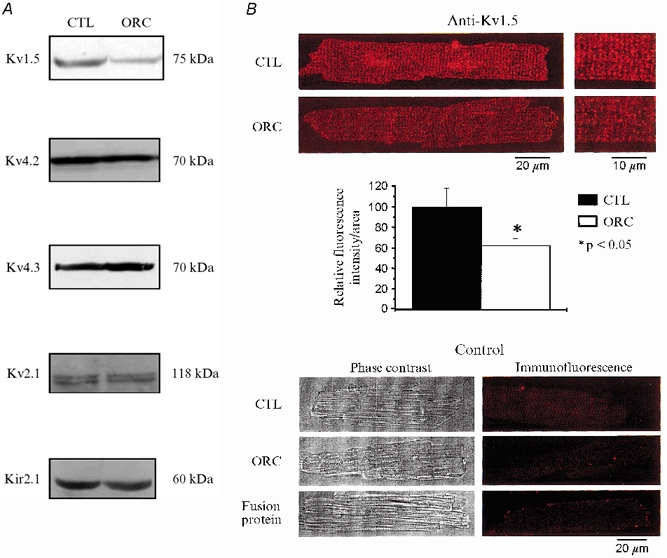
We previously demonstrated that female mouse ventricles have longer action potential durations (APDs) than males. This delayed repolarization results from a lower current density of the ultrarapid delayed rectifier K(+) current (I(K,ur)) and a lower expression level of its underlying K(+) channel (Kv1.5). To evaluate whether this sex difference could be attributable to the action of male sex hormones, we studied the effect of androgen deficiency on ventricular repolarization. We compared cardiac electrophysiological properties in castrated (orchiectomized; ORC) and control (CTL) male mice. Q-Tc intervals as well as APDs measured at 20 %, 50 % and 90 % of repolarization were all significantly longer in ORC than in CTL. The current density of I(K,ur) was significantly lower in ORC than in CTL (at +50 mV, ORC: 29 +/- 4 pA pF(-1), n = 25; CTL: 48 +/- 5 pA pF(-1), n = 17; P = 0.006). In contrast, all the other K(+) currents present in mouse ventricular myocytes were comparable between ORC and CTL. Moreover, results of Western blot analysis showed a lower expression level of Kv1.5 protein in ORC but no difference between the two groups for the other K(+) channels studied. This study demonstrates that androgen deficiency leads to a reduction in the density of I(K,ur) and Kv1.5 in mouse ventricle, and consequently, to prolongation of APD and Q-Tc interval. In conclusion, these findings strongly suggest that male sex hormones contribute to the sex difference that we previously reported in cardiac repolarization in adult mouse heart.


Figures

Figure 1
Figure 1. Comparison of Q-T interval between CTL and ORC mice
A, examples of lead I surface ECG obtained from one CTL and one ORC male mouse. B, table comparing mean Q-T, Q-Tc and heart rate (HR) in CTL and ORC mice.
Figure 2
Figure 2. Comparison of action potentials between CTL and ORC mouse ventricular myocytes
A, typical examples of action potentials recorded from CTL and ORC mice. Dotted lines represent the 0 mV level. B, mean APD at 20 %, 50 % and 90 % of repolarization in CTL and ORC mice. Action potentials were recorded at a frequency of 4 Hz. Recordings shown in this and all subsequent figures were measured at room temperature.
Figure 3
Figure 3. Comparison of total K+ current (Ipeak) and IK,slow (IK,ur+Iss) between CTL and ORC mouse ventricular myocytes
A, family of K+ currents recorded from CTL and ORC myocytes. Membrane currents were activated using the voltage protocol shown in the inset. B, mean I-V relationships for the total K+ current (Ipeak) in CTL and ORC ventricular myocytes. C, superimposed current traces of IK,slow in CTL and ORC cells. IK,slow was activated by 500 ms voltage steps preceded by a 100 ms inactivating prepulse to −40 mV. D, mean I-V curves for IK,slow recorded from CTL and ORC mice. Note that the current densities of IK1, which was activated by voltage steps ranging from −110 mV to −40 mV, were similar between ORC and CTL mice.
Figure 4
Figure 4. Comparison of the transient outward K+ current (Ito) and the steady-state K+ current (Iss) between CTL and ORC mouse ventricular myocytes
A, superimposed current records illustrating Ito were obtained by subtracting the corresponding currents recorded with (Fig. 3C) and without (Fig. 3A) the inactivating prepulse. B, mean I-V relationships for Ito in CTL and ORC mice. C, representative examples of Iss in CTL and ORC myocytes. Iss was measured after application of 200 μm 4-AP using the inactivation prepulse protocol. D, I-V curves for Iss recorded from CTL and ORC mice. NS, not significant.
Figure 5
Figure 5. Comparison of IK,ur between CTL and ORC mouse ventricular myocytes
A, family of membrane currents obtained by subtracting pairs of currents recorded with (Fig. 4C) and without (Fig. 3C) application of 200 μm 4-AP in CTL and ORC cells. B, mean I-V curves for IK,ur recorded from CTL and ORC mice.
Figure 6
Figure 6. Comparison of kinetic parameters for IK,ur between CTL and ORC ventricular myocytes
A, superimposed current records showing voltage dependence of steady-state inactivation for IK,ur in CTL and ORC myocytes. The cells were held at various test potentials varying from −110 to −20 mV for 5 s. A 2.5 s voltage step to +30 mV preceded by an inactivating prepulse (at −40 mV for 100 ms) was then applied to measure the remaining current. B, graph comparing the voltage dependence of steady-state inactivation of IK,ur between CTL and ORC mice. I/Imax is the current normalized to the current obtained with the −110 mV voltage step. Smooth lines are best-fit Boltzmann functions. C, family of current recordings showing the time course of recovery from inactivation for IK,ur in CTL and ORC cells. Two voltage steps (+30 mV; P1 = 1500 ms, P2 = 500 ms) separated by 50, 100, 150, 200, 250, 500, 750, 1000, 2000 and 3000 ms were applied. Both steps were preceded by the Ito inactivating prepulse. D, graph comparing reactivation of IK,ur between CTL and ORC myocytes. P2/P1 represents the ratio of the amplitude of the current generated by each pulse.
Figure 7
Figure 7. Western blot and immunofluorescence detection of K+ channel expression in CTL and ORC male mouse ventricle
A, comparison of K+ channel protein expression in CTL and ORC ventricles. Western blot analysis of Kv1.5 (1:500), Kv4.2 (1:500), Kv4.3 (1:4000), Kv2.1 (1:300) and Kir2.1 (1:500) in sarcolemmal-enriched proteins (100 μg lane−1) isolated from CTL and ORC mouse ventricles (n = 2 per group; 3 pooled ventricles per n value). Antibodies used were all obtained from Alomone Labs (Jerusalem, Israel), with the exception of Kv1.5, which was purchased from Upstate Biotechnology (Lake Placid, NY, USA). Equal protein loading was confirmed by Ponceau S-stained membranes. Furthermore, we used Kir2.1 as an internal control on the same Western blot gel as Kv1.5 and found no difference in the density of this protein (data not shown). B, immunofluorescence labelling of Kv1.5 in CTL and ORC male mouse ventricular myocytes. Upper panels (left), isolated cells were stained by exposure to the primary antibody and then to TRITC-conjugated donkey anti-rabbit secondary antibody (Jackson ImmunoResearch Laboratories Inc., Baltimore, PA, USA). The red fluorescence staining indicates the presence of Kv1.5 in CTL and ORC myocytes. Right, cells seen on the left at higher magnification. Middle panel, bar graph showing the relative fluorescence intensity of Kv1.5 in CTL and ORC myocytes (2 mice per group; 10 cells studied per mouse). Individual values of Kv1.5 fluorescence intensity corresponded to whole-cell fluorescence intensity. These values were obtained with the laser scanning microscopy software using an indicator that recorded fluorescence intensity at every pixel of the cell image. These measures were then normalized to cell surface area to account for cell size. Lower panels, phase-contrast images (left) and immunofluorescence detection (right) of the same CTL and ORC cells. These negative controls show that no staining was apparent when the primary antibody was omitted in CTL and ORC cells. The experiment using a fusion protein specific for the sequence of the antibody shows the specificity of the staining for Kv1.5.

References

    1. Barry DM, Xu H, Schuessler RB, Nerbonne JM. Functional knockout of the transient outward current, long-QT syndrome, and cardiac remodelling in mice expressing a dominant-negative Kv4 α-subunit. Circ Res. 1998;83:560–567. - PubMed
    1. Bazett H. An analysis of the time-relations of electrocardiograms. Heart. 1920;7:353–370.
    1. Berger F, Borchard U, Hafner D, Pütz I, Weis TM. Effects of 17β-estradiol on action potential and ionic currents in male rat ventricular myocytes. Naunyn Schmiedebergs Arch Pharmacol. 1997;356:788–796. - PubMed
    1. Bidoggia H, Maciel JP, Capalozza N, Mosca S, Blaksley EJ, Valverde E, Bertran G, Arini P, Biagetti MO, Quinteiro R. Sex difference on the electrocardiographic pattern of cardiac repolarization: possible role of testosterone. Am Heart J. 2000;140:678–683. - PubMed
    1. Chou TM, Sudhir K, Hutchison SJ, Ko E, Amidon TM, Collins P, Chatterjee K. Testosterone induces dilation of canine coronary conductance and resistance arteries in vivo. Circulation. 1996;94:2614–2619. - PubMed

Publication types

Substances

LinkOut - more resources