. 2003 Jan 15;546(Pt 2):551-64.
doi: 10.1113/jphysiol.2002.029751.

Uptake of locally applied deoxyglucose, glucose and lactate by axons and Schwann cells of rat vagus nerve

Affiliations

Uptake of locally applied deoxyglucose, glucose and lactate by axons and Schwann cells of rat vagus nerve

Céline Véga et al. J Physiol. .

Abstract

We asked whether, in a steady state, neurons and glial cells both take up glucose sufficient for their energy requirements, or whether glial cells take up a disproportionate amount and transfer metabolic substrate to neurons. A desheathed rat vagus nerve was held crossways in a laminar flow perfusion chamber and stimulated at 2 Hz. (14)C-labelled substrate was applied from a micropipette for 5 min over a < 0.6 mm band of the surface of the nerve. After 10-55 min incubation, the nerve was lyophilized and the longitudinal distribution of radioactivity measured. When the weakly metabolizable analogue of glucose, 2-deoxy-[U-(14)C]D-glucose (*DG), was applied, the profiles of the radioactivity broadened with time, reaching distances several times the mean length of the Schwann cells (0.32 mm; most of the Schwann cells are non-myelinating). The profiles were well fitted by curves calculated for diffusion in a single compartment, the mean diffusion coefficient being 463 +/- 34 microm(2) s(-1) (+/- S.E.M., n = 16). Applications of *DG were repeated in the presence of the gap junction blocker, carbenoxolone (100 microM). The profiles were now narrower and better fitted with two compartments. One compartment had a coefficient not significantly different from that in the absence of the gap junction blocker (axons), the other compartment had a coefficient of 204 +/- 24 microm(2) s(-1), n = 4. Addition of the gap junction blocker 18-alpha-glycyrrhetinic acid, or blocking electrical activity with TTX, also reduced longitudinal diffusion. Ascribing the compartment in which diffusion was reduced by these treatments to non-myelinating Schwann cells, we conclude that 78.0 +/- 3.6 % (n = 9) of the uptake of *DG was into Schwann cells. This suggests that there was transfer of metabolic substrate from Schwann cells to axons. Local application of [(14)C]glucose or [(14)C]lactate led to variable labelling along the length of the nerve, but with both substrates narrow peaks were often present at the application site; these were greatly reduced by subsequent treatment with amylase, a glycogen-degrading enzyme.


Figures
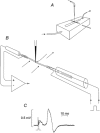
Figure 1
Figure 1. Local application of radioactive compounds
A, the perfusion chamber with lateral arms in which a length of nerve was mounted crossways. B, scheme of application from a micropipette of solution containing 14C-labelled substrate. The ends of the nerve are sucked into capillaries equipped with wires for stimulating and recording. C, example of a compound action potential, recorded 41 min after the nerve was mounted. The small component from myelinated fibres appears with a peak at about 3 ms; it is followed by the larger, partly biphasic, component from unmyelinated fibres.
Figure 5
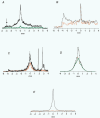
Figure 5. Typical profiles of radioactivity after uptake of [1-14C]d-glucose, and Na[U-14C]l-lactate
A, radioactivity profile of a nerve after incubation in [1-14C]d-glucose (*glucose; black) showing weak radioactivity all along the nerve, with a peak at the site of application (at 0 mm). After treatment of the lyophilized nerve with amylase (green), the peak at the site of application was greatly reduced. A very small and narrow peak (arrow) was only slightly reduced by amylase. *Glucose was applied for 5 min followed by 25 min incubation with stimulation. B, profile from another nerve after application of *glucose (black). After incubation of the nerve in Locke solution (orange), the narrow peak at the site of application was not significantly reduced. Initially, *glucose had been applied for 5 min, and the nerve then incubated for 25 min, with stimulation. C, after application of *glucose, very narrow peaks remote from the site of application were sometimes observed (black). These were abolished by treatment with trypsin (orange). *Glucose was applied for 5 min followed by incubation for 25 min in the presence of TTX. D, profile after application of *DG (black). Incubation of the lyophilized nerve in Locke solution reduced the central peak (orange). A subsequent incubation in Locke solution containing amylase hardly changed the profile (green). *DG was applied for 5 min followed by 15 min incubation, without stimulation. E, profile after application of Na[U-14C]l-lactate (*lactate; black). Treatment with amylase abolished the narrow peak at the site of application (orange). *Lactate was applied for 1 min followed by 14 min incubation with no stimulation.
Figure 2
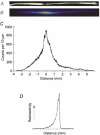
Figure 2. Imaging the distribution of radioactivity
Solution containing 2-deoxy-[U-14C]d-glucose (*DG) and Evans blue was applied to a narrow band of nerve for 5 min and the nerve was then incubated for 55 min and lyophilized; the mark left by the Evans blue is visible on the lyophilized nerve (A). The radioactivity was imaged for 121.5 h (B). A profile was obtained for a strip 580 μm wide with a longitudinal resolution of approximately 10 μm (C). To check the spatial resolution of the method, *DG was applied to the cut end of a nerve (D). In this case, *DG was applied for 10 min and the nerve was washed for 19 min before being frozen.
Figure 3
Figure 3. Characteristics of radioactivity profiles after local application of *DG
A, profiles after application of *DG for 5 min and incubation for 10 (black), 25 (orange) or 55 (green) min with stimulation. Individual profiles were normalized so that the area under each was the same, and then averaged for each time (2, 8 and 4 nerves respectively). B, the width of the peak at 30 % of the maximum height (W30) is plotted as a function of time from the beginning of the 5 min application of *DG. W30 for nerves in the presence of TTX (triangles) was less than for nerves that carried action potentials (squares). The height of the rectangle at time zero indicates the mean width of the Evans blue mark ± s.e.m., and its length the duration of the application. The dashed line is a theoretical calculation of W30 for diffusion of a substance with a diffusion coefficient of 470 μm2 s−1; this value is an estimate, extrapolated from the literature, of the diffusion coefficient of DG-6P within a cell (see Discussion). C, experimental modification of the diffusion of radioactivity from *DG. In the presence of 18-α-glycerrhetinic acid (orange) the width of the profile was less than in control solution containing DMSO (blue). *DG was applied for 5 min and the nerves incubated for 25 min, with electrical stimulation. Two profiles were normalized and averaged for each condition. D. The profile for each nerve was characterized by fitting a diffusion curve for a single compartment with a coefficient D (see Fig. 4A and Appendix). The histogram shows mean values of D under different conditions, all for 5 min application of *DG and 25 min incubation. Bars indicate s.e.m. *P < 0.05, **P < 0.01. ‘Stim’, stimulated in the absence of drugs; ‘Carben’, carbenoxolone; ‘Halo’, halothane.
Figure 4
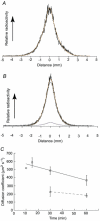
Figure 4. Fitting curves to calculate D
A, experimental profile (black) for a nerve under control conditions (30 min: application of *DG for 5 min followed by 25 min incubation during electrical stimulation). This profile was fitted with a calculated curve (orange) for a single compartment to obtain a value for D. In the presence of gap junction blockers, or, as in B, TTX, the profiles were narrowed (B, black line). The experimental profile was now better fitted as the sum (orange) of a small component that was not slowed (blue) and a slow component (green). C, mean values for different incubation times of diffusion coefficients used to fit profiles. The mean values of D for the single-compartment analysis of nerves stimulated in the absence of drugs are plotted as squares. Bars are s.e.m. values and there was only one value for 10 min. The line is a linear regression through the data points, r2= 0.27. Mean values for the diffusion coefficient, D2, of the slower component used to fit profiles from TTX experiments are shown by triangles. (The components were not clearly resolved in the available profiles for 15 min).

Comment in

References

    1. Attwell D, Laughlin SB. An energy budget for signaling in the grey matter of the brain. J Cereb Blood Flow Metab. 2001;21:1133–1145. - PubMed
    1. Bachelard HS. Specificity and kinetic properties of monosaccharide uptake into guinea pig cerebral cortex in vitro. J Neurochem. 1971;18:213–222. - PubMed
    1. Bouzier AK, Thiaudiere E, Biran M, Rouland R, Canioni P, Merle M. The metabolism of [3-13C]lactate in the rat brain is specific of a pyruvate carboxylase-deprived compartment. J Neurochem. 2000;75:480–486. - PubMed
    1. Brock R, Hink MA, Jovin TM. Fluorescence correlation microscopy of cells in the presence of autofluorescence. Biophys J. 1998;75:2547–2557. - PMC - PubMed
    1. Brooks GA. Lactate shuttles in nature. Biochem Soc Trans. 2002;30:258–264. - PubMed

LinkOut - more resources