. 2003 Jan 20;160(2):235-43.
doi: 10.1083/jcb.200207111. Epub 2003 Jan 13.

Spatio-temporal activation of caspase revealed by indicator that is insensitive to environmental effects

Affiliations

Spatio-temporal activation of caspase revealed by indicator that is insensitive to environmental effects

Kiwamu Takemoto et al. J Cell Biol. .

Abstract

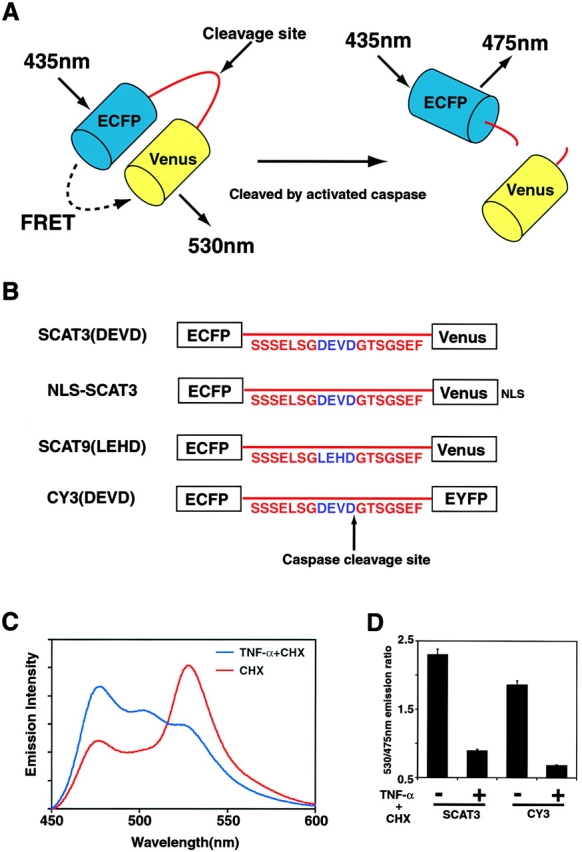
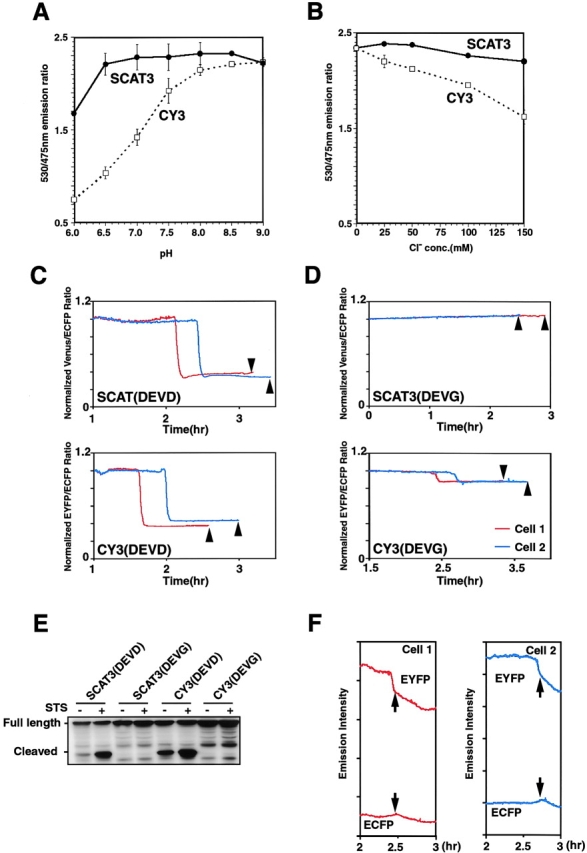
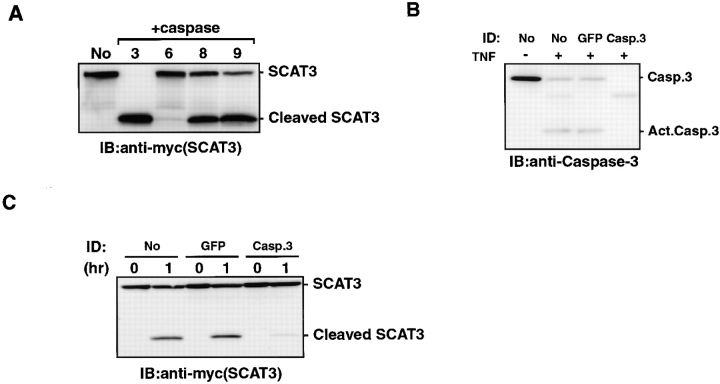
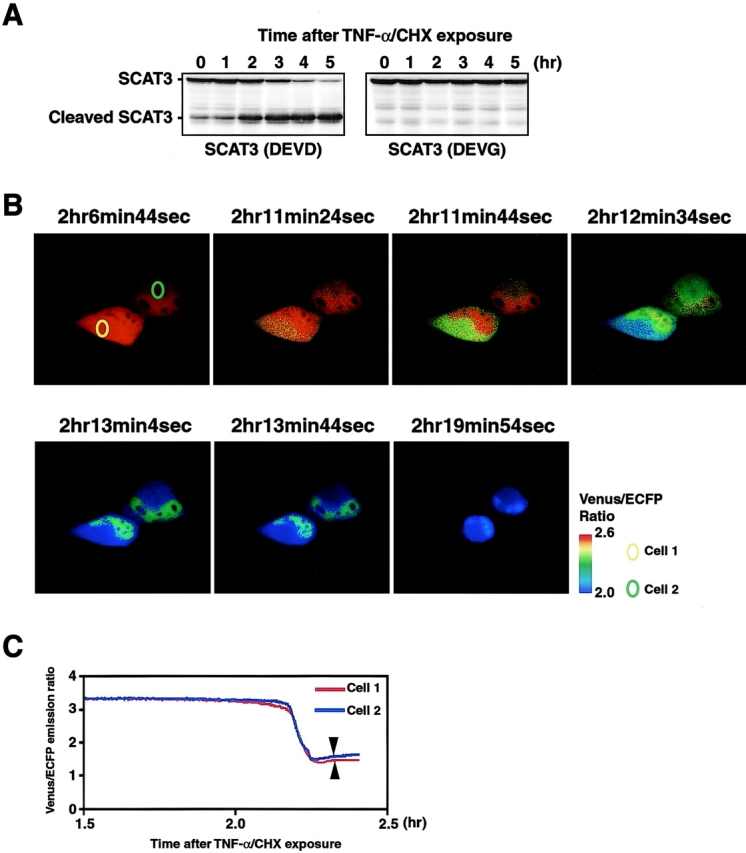
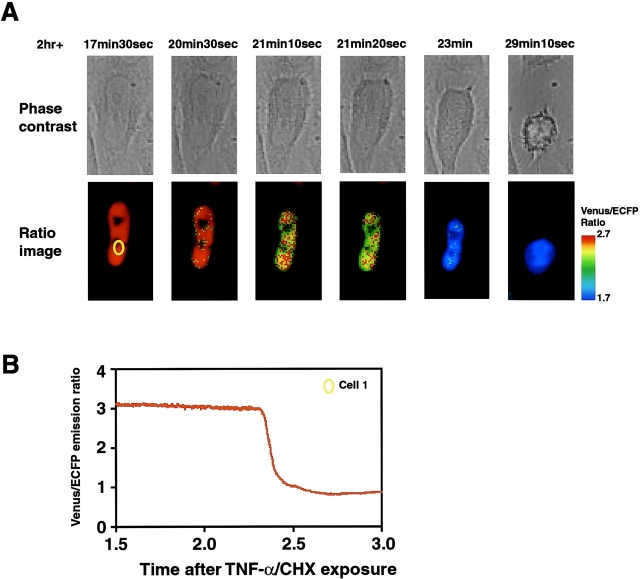
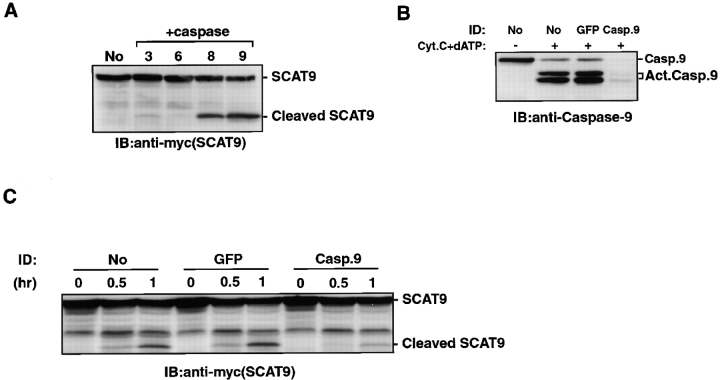
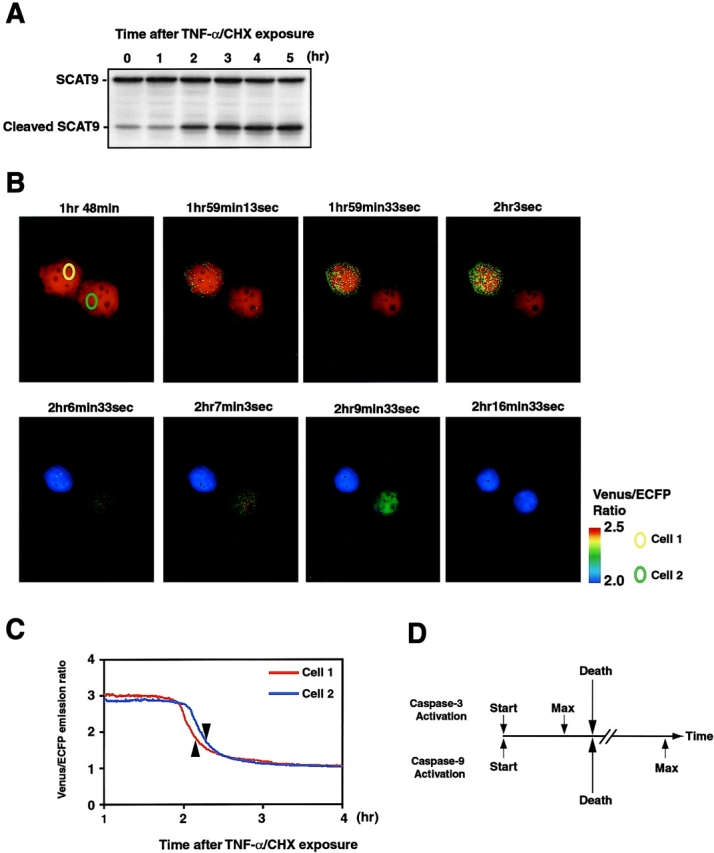
Indicator molecules for caspase-3 activation have been reported that use fluorescence resonance energy transfer (FRET) between an enhanced cyan fluorescent protein (the donor) and enhanced yellow fluorescent protein (EYFP; the acceptor). Because EYFP is highly sensitive to proton (H+) and chloride ion (Cl-) levels, which can change during apoptosis, this indicator's ability to trace the precise dynamics of caspase activation is limited, especially in vivo. Here, we generated an H+- and Cl--insensitive indicator for caspase activation, SCAT, in which EYFP was replaced with Venus, and monitored the spatio-temporal activation of caspases in living cells. Caspase-3 activation was initiated first in the cytosol and then in the nucleus, and rapidly reached maximum activation in 10 min or less. Furthermore, the nuclear activation of caspase-3 preceded the nuclear apoptotic morphological changes. In contrast, the completion of caspase-9 activation took much longer and its activation was attenuated in the nucleus. However, the time between the initiation of caspase-9 activation and the morphological changes was quite similar to that seen for caspase-3, indicating the activation of both caspases occurred essentially simultaneously during the initiation of apoptosis.


Figures

Figure 1.
Figure 1.
An improved indicator for activated caspases: SCAT. (A) Schematic representation of SCAT. (B) Linker sequences of the SCAT family of indicators. (C) Spectral analysis of SCAT3 in cells exposed to TNF-α/CHX. HeLa cells in 100-mm dishes were transfected with 6 μg pcDNA-SCAT3. 18 h after transfection, the cells were exposed to CHX or TNF-α/CHX and incubated for 6 h. The cell suspensions were then subjected to spectral analysis. (D) Changes in the emission ratio (530/475 nm) of SCAT3 compared with CY3 in cells treated with TNF-α/CHX. The cell suspensions were prepared as described above. The 530/475-nm emission ratio was measured with an excitation wavelength at 435 nm. The data represent results from three independent experiments. Error bars indicate SD.
Figure 2.
Figure 2.
Properties of SCAT3 and CY3. pH resistance (A) and Cl resistance (B) of SCAT3 compared with CY3. HeLa cells transfected with pcDNA-SCAT3 or pCFP-DEVD-YFP were lysed with 0.5% Triton X-100–containing buffer. The 530/475-nm emission ratio was determined with a 435-nm excitation wavelength. The data represent results from three independent experiments. Error bars indicate SD. (C and D) The stability of SCAT compared with CY3 in living single cells. The imaging analysis was started on exposing HeLa cells to 1 μM STS at 18 h after transfection. To compare SCAT3 and CY3, the emission ratio was normalized by defining the baseline ratio before the FRET disruption as 1. Arrowheads indicate the time cells first showed the early apoptotic cell death morphology, including membrane blebbing and cell shrinkage. (E) Western blot analysis of SCAT3- or CY3-expressing HeLa cells exposed by STS. (F) The emission intensity profiles of EYFP and ECFP in CY3 (DEVG)-expressing HeLa cells. Cells 1 and 2 are the same as those shown in D. Arrows indicate the time of the emission ratio decrease in CY3 (DEVG) in D.
Figure 3.
Figure 3.
The specificity of SCAT3 for activated caspase-3 in TNF-α/CHX-treated HeLa cell lysates. (A) In vitro cleavage analysis of SCAT3. SCAT3 synthesized in vitro was incubated with 1 U of purified activated caspase-3, -6, -8, or -9 for 1 h. The reaction mixture was subjected to Western blotting using an anti-myc mAb. (B) Immunodepletion of caspase-3 from TNF-α/CHX-treated HeLa cell lysates. 20 μg of immunodepleted lysates were subjected to Western blotting using an anti–caspase-3 rabbit pAb (Invitrogen). (C) Cleavage assay of SCAT3 in caspase-3–depleted lysates. SCAT3 synthesized in vitro was incubated with 12 μg caspase-3–depleted lysates prepared from TNF-α/CHX-treated HeLa cells for the indicated periods, and then its cleavage was examined by Western blotting using an anti-myc antibody.
Figure 4.
Figure 4.
Single-cell imaging analysis of SCAT3-expressing living HeLa cells. (A) Western blot analysis of SCAT3-expressing HeLa cells exposed to TNF-α/CHX. HeLa cells in a 6-well plate were transfected with 1 μg pcDNA-SCAT3. Cells were exposed to 50 ng/ml TNF-α and 10 μg/ml CHX 18 h after transfection. The cells were then lysed with sample buffer at the indicated times. The lysates were examined by Western blotting using an anti-myc antibody. (B) Ratio images of the SCAT3- expressing cells. HeLa cells were transfected with 0.5 μg pcDNA-SCAT3. Imaging analysis was started 18 h after transfection. (C) Venus/ECFP emission ratio changes of individual cells examined in B. Arrowheads indicate the time cells first showed the early apoptotic cell death morphology, including membrane blebbing and cell shrinkage.
Figure 5.
Figure 5.
Nuclear activation of caspase-3 precedes apoptotic nuclear changes. (A) Ratio images and phase-contrast images of NLS-SCAT–expressing cells. HeLa cells were transfected with 0.5 μg pcDNA-SCAT3. Imaging analysis was started 18 h after transfection. (B) Venus/ECFP emission ratio changes of individual cells examined in A.
Figure 6.
Figure 6.
Specificity of SCAT9 for activated caspase-9 in apoptotic HeLa cell extract. (A) In vitro cleavage analysis of SCAT9. SCAT9 synthesized in vitro was cleaved by purified activated caspase-3, -6, -8, or -9 for 1 h. The reaction mixture was then subjected to Western blotting using an anti-myc mAb. (B) Immunodepletion of caspase-9 from dATP/cytochrome c activated apoptotic HeLa extract. Immunodepleted extracts (18 μg) were subjected to Western blotting using an anti-caspase-9 mouse mAb. Both the precursor and activated forms of caspase-9 could be depleted from the extracts. (C) Cleavage assay of SCAT9 in caspase-9–depleted apoptotic extracts. SCAT9 synthesized in vitro was incubated with 18 μg caspase-9–depleted apoptotic extracts for the indicated periods. The reacted lysates were then examined by Western blotting using an anti-myc antibody.
Figure 7.
Figure 7.
Single-cell imaging analysis of caspase-9 activation using SCAT9. (A) Western blot analysis of SCAT9-expressing HeLa cells treated with TNF-α/CHX. HeLa cells cultured in a 6-well plate were transfected with 1 μg pcDNA-SCAT9. The cells were treated with 50 ng/ml TNF-α and 10 μg/ml CHX 18 h after the transfection. The cells were then lysed with sample buffer at the indicated times. The lysates were examined by Western blotting using an anti-myc antibody. (B) Ratio images of the SCAT9-expressing HeLa cells exposed to 50 ng/ml TNF-α and 10 μg/ml CHX. HeLa cells were transfected with 0.5 μg pcDNA-SCAT9. Imaging analysis was started 18 h after transfection. (C) Venus/ECFP emission ratio changes of individual cells examined in B. Arrowheads indicate the time cells first showed early apoptotic cell death morphological changes, such as membrane blebbing and cell shrinkage. (D) Schematic representation of the activation profile of caspase-3 (DEVDase) and -9 (LEHDase). Arrows indicate the time point of each event.

References

    1. Araki, T., M. Hayashi, N. Watanabe, H. Kanuka, J. Yoshino, M. Miura, and T. Saruta. 2002. Down-regulation of Mcl-1 by inhibition of the PI3-K/Akt pathway is required for cell shrinkage-dependent cell death. Biochem. Biophys. Res. Commun. 290:1275–1281. - PubMed
    1. Cecconi, F., G. Alvarez-Bolado, B.I. Meyer, K.A. Roth, and P. Gruss. 1998. Apaf1 (CED-4 homolog) regulates programmed cell death in mammalian development. Cell. 94:727–737. - PubMed
    1. Chandler, J.M., G.M. Cohen, and M. MacFarlane. 1998. Different subcellular distribution of caspase-3 and caspase-7 following Fas-induced apoptosis in mouse liver. J. Biol. Chem. 273:10815–10818. - PubMed
    1. Cryns, V., and J. Yuan. 1998. Proteases to die for. Genes Dev. 12:1551–1570. - PubMed
    1. Eguchi, Y., A. Srinivasan, K.J. Tomaselli, S. Shimizu, and Y. Tsujimoto. 1999. ATP-dependent steps in apoptotic signal transduction. Cancer Res. 59:2174–2181. - PubMed

Publication types

MeSH terms