. 2003 Jan 20;160(2):189-200.
doi: 10.1083/jcb.200211046. Epub 2003 Jan 13.

Mitofusins Mfn1 and Mfn2 coordinately regulate mitochondrial fusion and are essential for embryonic development

Affiliations

Mitofusins Mfn1 and Mfn2 coordinately regulate mitochondrial fusion and are essential for embryonic development

Hsiuchen Chen et al. J Cell Biol. .

Abstract

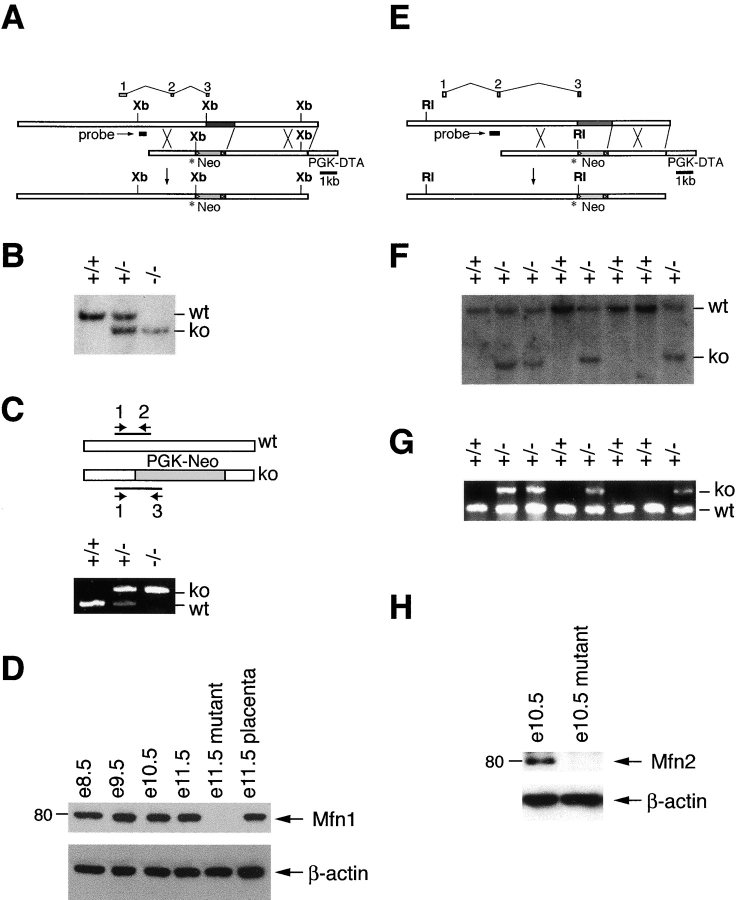
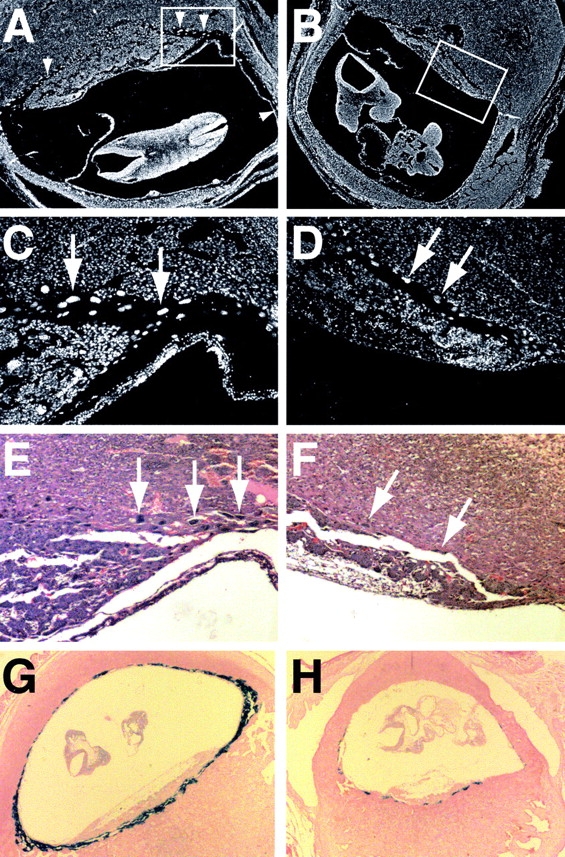
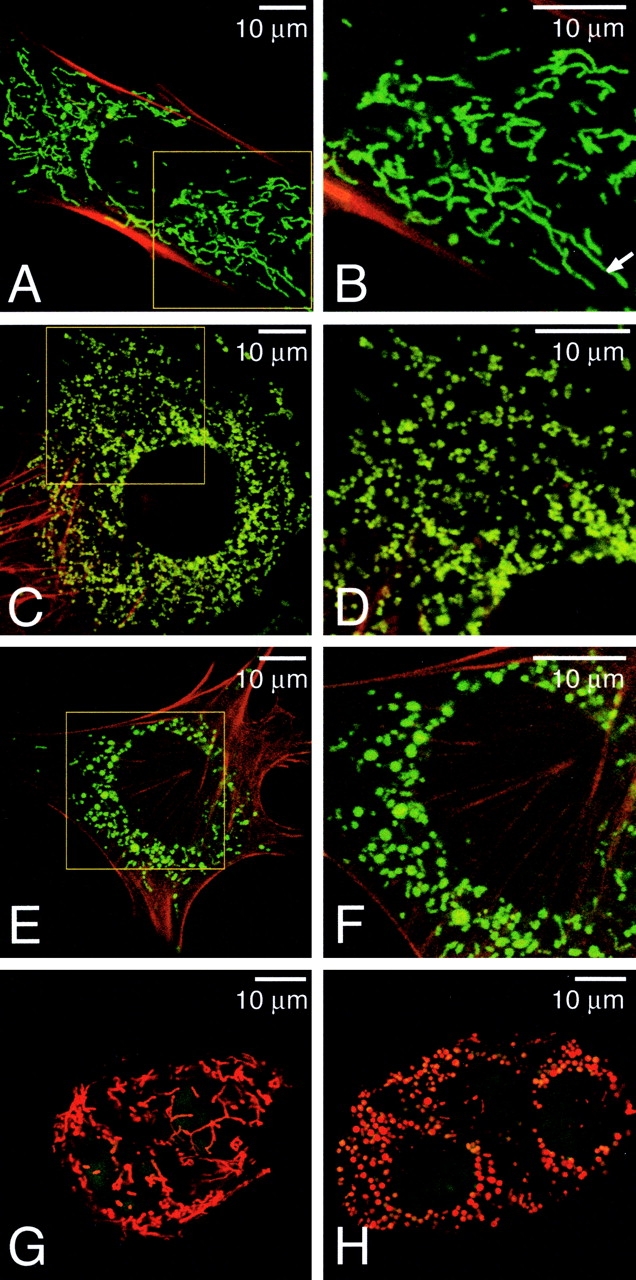
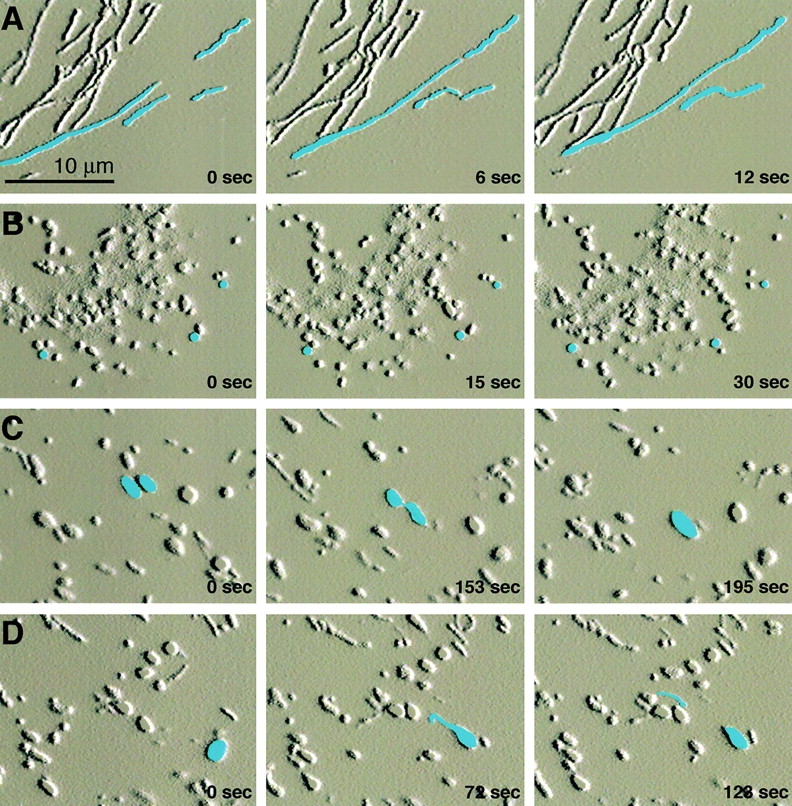
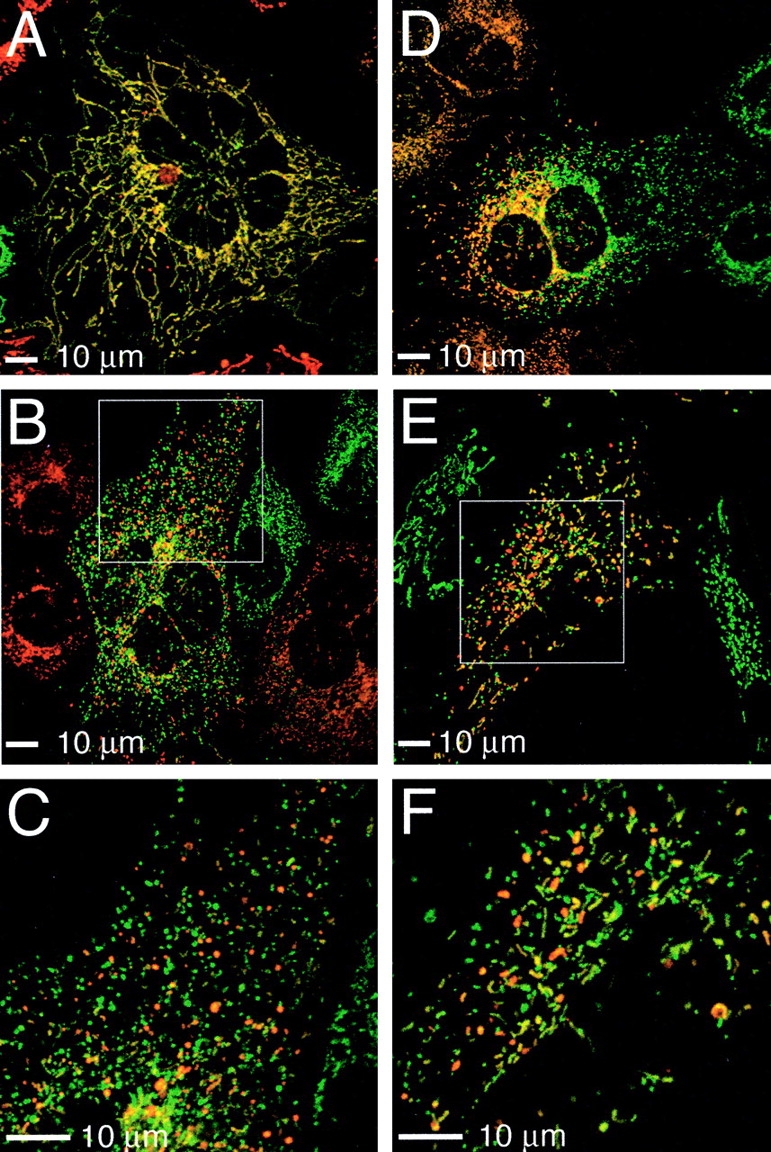
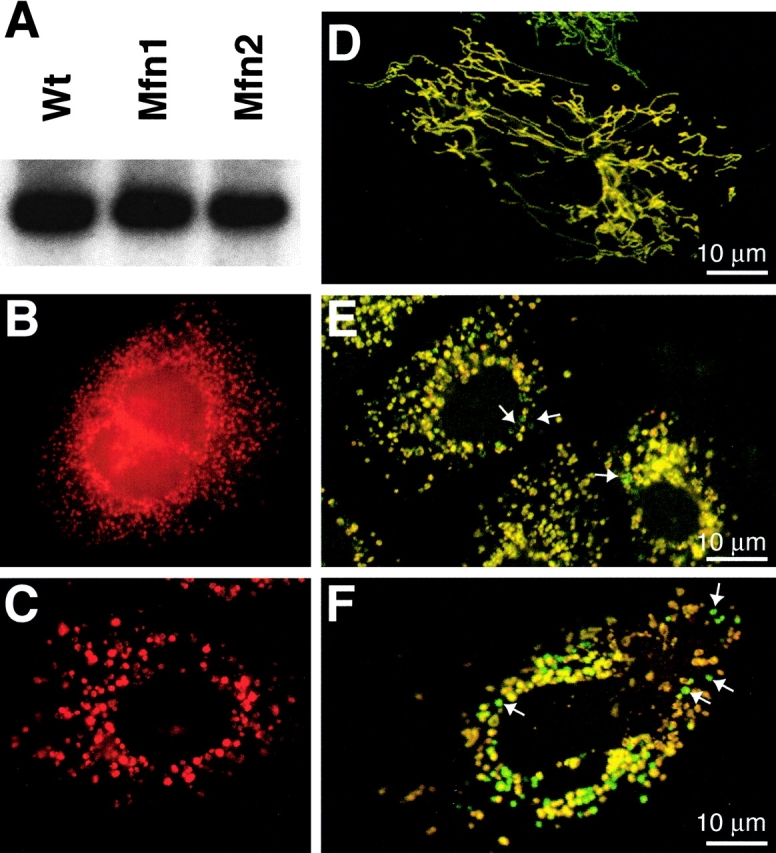
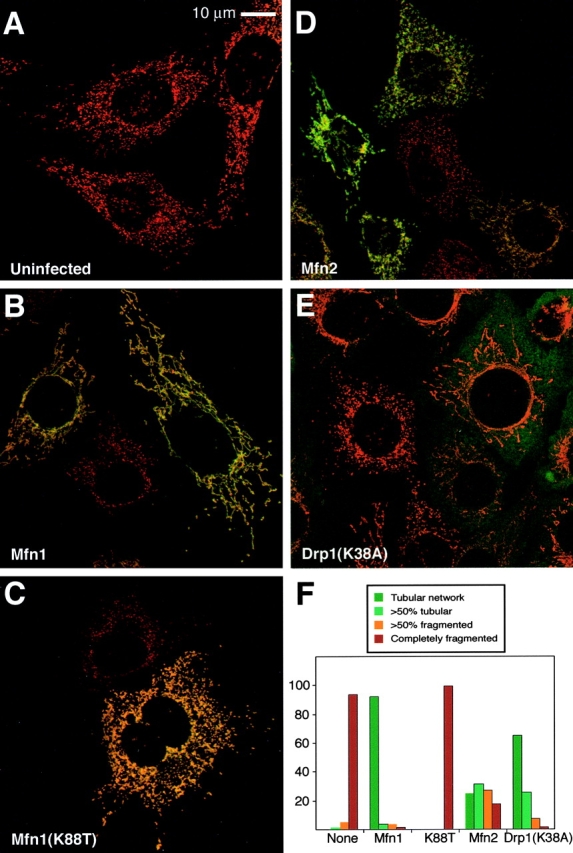
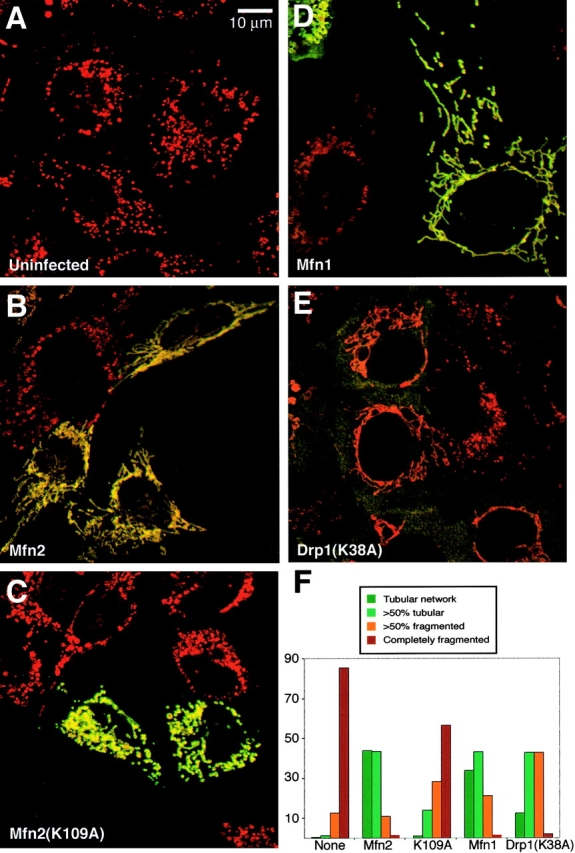
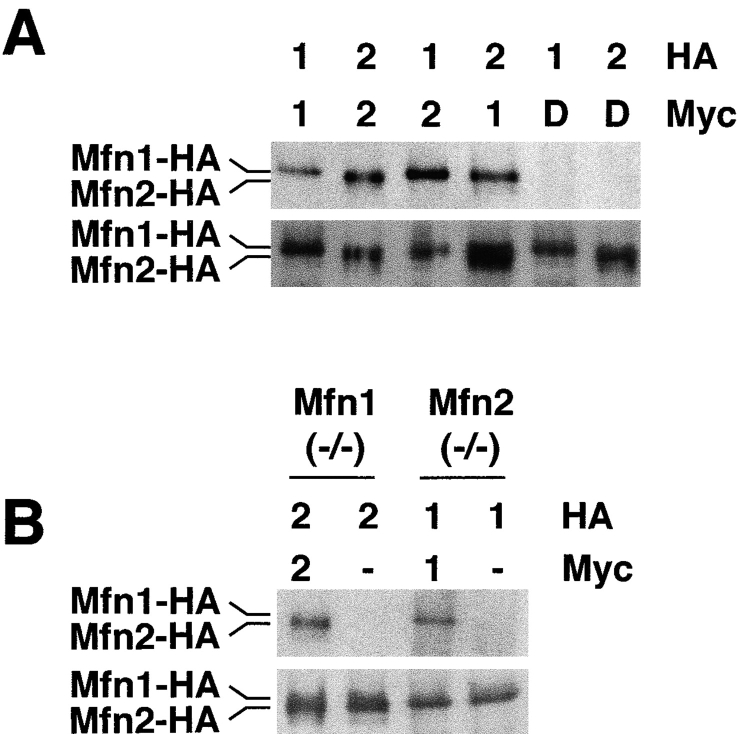
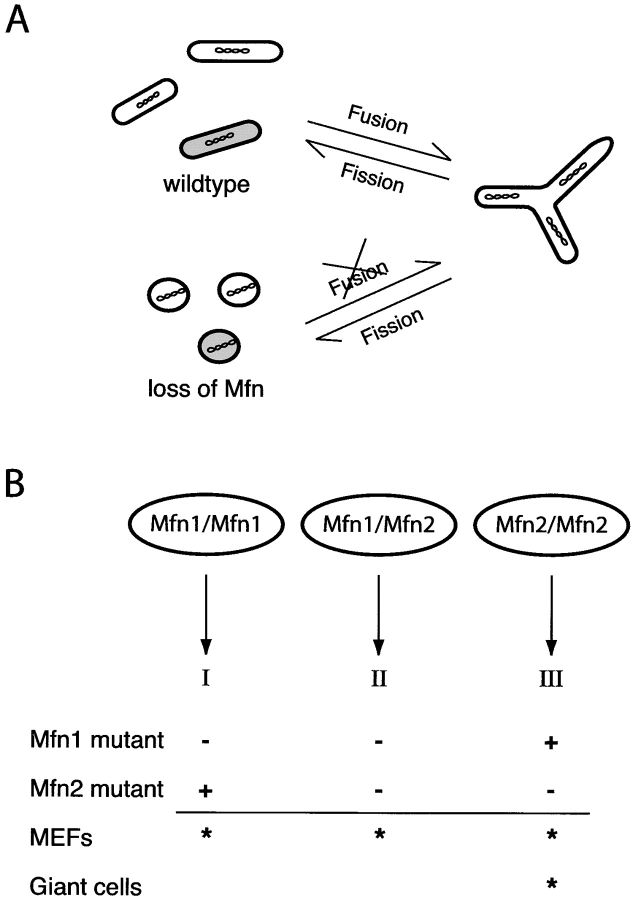
Mitochondrial morphology is determined by a dynamic equilibrium between organelle fusion and fission, but the significance of these processes in vertebrates is unknown. The mitofusins, Mfn1 and Mfn2, have been shown to affect mitochondrial morphology when overexpressed. We find that mice deficient in either Mfn1 or Mfn2 die in midgestation. However, whereas Mfn2 mutant embryos have a specific and severe disruption of the placental trophoblast giant cell layer, Mfn1-deficient giant cells are normal. Embryonic fibroblasts lacking Mfn1 or Mfn2 display distinct types of fragmented mitochondria, a phenotype we determine to be due to a severe reduction in mitochondrial fusion. Moreover, we find that Mfn1 and Mfn2 form homotypic and heterotypic complexes and show, by rescue of mutant cells, that the homotypic complexes are functional for fusion. We conclude that Mfn1 and Mfn2 have both redundant and distinct functions and act in three separate molecular complexes to promote mitochondrial fusion. Strikingly, a subset of mitochondria in mutant cells lose membrane potential. Therefore, mitochondrial fusion is essential for embryonic development, and by enabling cooperation between mitochondria, has protective effects on the mitochondrial population.


Figures

Figure 1.
Figure 1.
Construction and verification of knockout mice. (A) Genomic targeting of Mfn1. The top bar indicates the wild-type Mfn1 genomic locus with exons aligned above. The dark gray segment contains coding sequences for the G1 and G2 motifs of the GTPase domain. A double crossover with the targeting construct (middle bar) results in a targeted allele (bottom bar) containing a premature stop codon (asterisk) in exon 3 and a substitution of the G1 and G2 encoding genomic sequence with a neomycin- resistance gene (light gray segment labeled Neo; flanking loxP sites indicated by triangles). PGK-DTA, diphtheria toxin subunit A driven by the PGK promoter; Xb, XbaI. (E) Genomic targeting of Mfn2. Drawn as in A. RI, EcoRI. (B and F) Southern blot analyses of targeted embryonic stem clones and offspring. Genomic DNAs were digested with XbaI (B) for Mfn1 and EcoRI (F) for Mfn2 and analyzed with the probes indicated in A and E. The wild-type and knockout bands are indicated as are genotypes. (C and G) PCR genotyping. Three primers (labeled 1, 2, and 3) were used simultaneously to amplify distinct fragments from the wild-type and mutant loci. The DNA samples are identical to those in B and F, respectively. (D and H) Western analyses of wild-type and mutant lysates. Postnuclear embryonic lysates were analyzed with affinity-purified antibodies directed against Mfn1 (D) and Mfn2 (H). β-Actin was used as a loading control.
Figure 2.
Figure 2.
Defective giant cell layer of mutant placentae. (A–D) DAPI-stained sections of placentae from e10.5 wild-type (A and C) and mutant (B and D) littermate embryos. The boxed areas of A and B are enlarged in C and D. Arrows and arrowheads indicate trophoblast giant cells. Note that the giant cells in D are sparser and have smaller nuclei. (E and F) Hematoxylin-eosin–stained sections from the placentae above. (G and H) PL-I (giant cell marker) RNA in situ analysis of placentae from e9.5 wild-type (G) and mutant (H) littermates.
Figure 3.
Figure 3.
Morphological defects in mitochondria of mutant cells. (A–F) Mitochondrial morphology in wild-type (A and B), Mfn1 mutant (C and D), and Mfn2 mutant (E and F) MEF cells. MEFs expressing mitochondrial EYFP (green) were counterstained with rhodamine-phalloidin (red). (B, D, and F) Higher magnification images of the boxed areas in A, C, and E, respectively. Arrow indicates a tubule >10 μm in length. (G and H) Mitochondrial morphology in live wild-type (G) and mutant (H) TS cells. The mitochondria were stained with MitoTracker Red, and the nuclei were stained with Syto16 (green). Several cells are tightly clustered.
Figure 4.
Figure 4.
Dynamics of mitochondria in wild-type and mutant cells. Still frames from time-lapse confocal microscopy. (A) In a wild-type cell, two pairs of mitochondria can be seen moving toward each other. These pairs contact end-to-end and fuse immediately. Note that mitochondria move along their long axes. (B) In a Mfn1 mutant cell, the mitochondria move in an undirected manner. (C) In a Mfn2 mutant cell, two ovoid mitochondria contact each other but do not fuse until much later. Note also the lack of directed movement in most mitochondria. (D) One spherical Mfn2-deficient mitochondrion protrudes a tubular extension that separates and then migrates away along its long axis. Images were processed in Adobe Photoshop® with the emboss filter, and selected mitochondria were manually highlighted in blue. See also videos 1–3 available at http://www.jcb.org/cgi/content/full/jcb.200211046/DC1.
Figure 5.
Figure 5.
Mitochondrial fusion assay. PEG fusion of cells containing mitochondrially targeted dsRed and GFP. (A) Wild-type cell showing extensive mitochondrial fusion. (B and E) Mfn1 (B) and Mfn2 (E) mutant cells displaying predominantly unfused mitochondria. (C and F) Magnified views of boxed portions in B and E, respectively. (D) Sectoring effect in Mfn1 mutant cell.
Figure 6.
Figure 6.
Stochastic loss of membrane potential in mitochondria of mutant cells. (A) mtDNA is detected by Southern blot analysis using a COX1 probe. (B and C) COXI expression in Mfn1 (B) and Mfn2 (C) mutant cells. (D–F) Staining of mitochondria using dyes sensitive to membrane potential. Wild-type (D), Mfn1 mutant (E), and Mfn2 mutant (F) cells expressing mitochondrially targeted EYFP (green) were stained with the dye MitoTracker Red, whose sequestration into mitochondria is sensitive to membrane potential. In these merged images, note that in the mutant cells (E and F) a subset of mitochondria (arrows) stain poorly with MitoTracker Red and thus appear green.
Figure 7.
Figure 7.
Rescue of Mfn1-deficient cells Mfn1 mutant cells. Mfn1 mutant cells (A) were infected with a retrovirus expressing Myc epitope-tagged versions of Mfn1 (B), Mfn1(K88T) (C), Mfn2 (D), or dominant- negative Drp1(K38A) (E). In the merged images, mitochondrial morphology is revealed by MitoTracker Red staining, and infected cells are identified by immunofluorescence with an anti-Myc antibody (green). In E, the signals are largely nonoverlapping because most of the Drp1 resides in a cytosolic pool. The results are summarized in F, which depicts the percentage of infected cells belonging to each of four morphological classifications. 600 cells were scored for each infection.
Figure 8.
Figure 8.
Rescue of Mfn2-deficient cells Mfn2 mutant cells. Mfnz mutant cells (A) were infected with a retrovirus expressing Myc epitope-tagged versions of Mfn2 (B), Mfn2(K109A) (C), Mfn1 (D), or dominant-negative Drp1(K38A) (E). The cells were stained as in Fig. 7. The results are summarized in F. 200 cells were scored for each infection.
Figure 9.
Figure 9.
Immunoprecipitation of Mfn complexes. (A) Wild-type cells were infected with retroviruses expressing Myc- or HA-tagged Mfn1 (labeled 1), Mfn2 (labeled 2), or Drp1 (labeled D) as indicated on top. Anti-Myc immunoprecipitates (top) and total cell lysates (bottom) were analyzed by Western blotting against the HA epitope. The total cell lysate samples contain one sixth cell equivalents compared with the immunoprecipitates. (B) Anti-Myc immunoprecipitates (top) and total cell lysates (bottom) from Mfn1 or Mfn2 mutant cells (indicated on top) were used in an analysis similar to A.
Figure 10.
Figure 10.
Models. (A) The protective role of mitochondrial fusion. At a low rate, individual mitochondria stochastically lose function. In wild-type cells, a defective mitochondrion (shaded) undergoes fusion with functional mitochondria and regains activity. In Mfn- deficient cells, such rescue occurs at a much reduced rate. (B) Three modes of mitofusin action. Mitofusins form homotypic and heterotypic complexes that lead to three activities (I, II, III) involving fusion. See Discussion for details. Mfn1 mutant cells contain only activity III; Mfn2 mutant cells contain only activity I. Since disruption of either Mfn1 or Mfn2 fragments mitochondria and results in distinct phenotypes, MEFs appear to use all three activities (indicated by asterisks). In contrast, trophoblast giant cells predominantly use activity III because they are affected in Mfn2 mutants and not Mfn1 mutants.

References

    1. Bakeeva, L.E., S. Chentsov Yu, and V.P. Skulachev. 1978. Mitochondrial framework (reticulum mitochondriale) in rat diaphragm muscle. Biochim. Biophys. Acta. 501:349–369. - PubMed
    1. Bakeeva, L.E., Y.S. Chentsov, and V.P. Skulachev. 1981. Ontogenesis of mitochondrial reticulum in rat diaphragm muscle. Eur. J. Cell Biol. 25:175–181. - PubMed
    1. Bakeeva, L.E., S. Chentsov Yu, and V.P. Skulachev. 1983. Intermitochondrial contacts in myocardiocytes. J. Mol. Cell. Cardiol. 15:413–420. - PubMed
    1. Bereiter-Hahn, J., and M. Voth. 1994. Dynamics of mitochondria in living cells: shape changes, dislocations, fusion, and fission of mitochondria. Microsc. Res. Tech. 27:198–219. - PubMed
    1. Bleazard, W., J.M. McCaffery, E.J. King, S. Bale, A. Mozdy, Q. Tieu, J. Nunnari, and J.M. Shaw. 1999. The dynamin-related GTPase Dnm1 regulates mitochondrial fission in yeast. Nat. Cell Biol. 1:298–304. - PMC - PubMed

Publication types

MeSH terms