

Review
doi: 10.1101/gr.222003.
Cross-species sequence comparisons: a review of methods and available resources
Affiliations
- PMID: 12529301
- PMCID: PMC430969
- DOI: 10.1101/gr.222003
Item in Clipboard
Review
Cross-species sequence comparisons: a review of methods and available resources
Genome Res.
2003 Jan.
Abstract
With the availability of whole-genome sequences for an increasing number of species, we are now faced with the challenge of decoding the information contained within these DNA sequences. Comparative analysis of DNA sequences from multiple species at varying evolutionary distances is a powerful approach for identifying coding and functional noncoding sequences, as well as sequences that are unique for a given organism. In this review, we outline the strategy for choosing DNA sequences from different species for comparative analyses and describe the methods used and the resources publicly available for these studies.
Figures
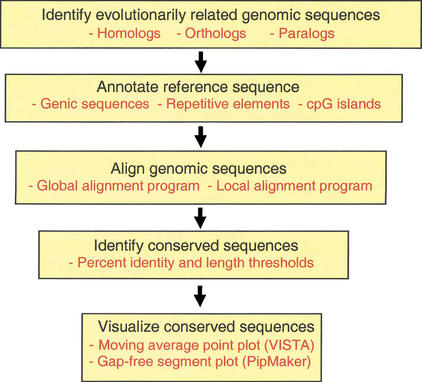
Multistep process of comparative sequence analysis. Evolutionarily related sequences must be identified. The reference sequence should be annotated for known functional elements. Sequences to be compared must be aligned. Evolutionarily conserved sequences are identified based on specified thresholds (such as percent identity and length) of conservation. Visualization tools allow the individual to view the annotations, sequence alignments, and conserved elements simultaneously.
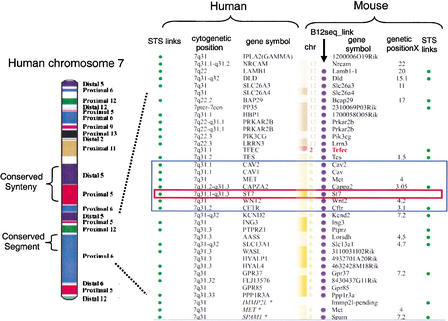
Comparative map between human chromosome 7 and the mouse genome. On the left is a representation of human chromosome 7 with blocks of conserved synteny color-coded based on their chromosomal position in the mouse genome (indicated on right-hand side; diagram from Thomas et al. 2000). In the middle of human chromosome 7 is one block of conserved synteny subdivided into two conserved segments, one from distal murine 5 and one from proximal murine 5. At the resolution of this diagram, intrachromosomal rearrangements present in the mouse genome cannot be visualized. On the right is a detailed comparative map of the human 7q31 interval with conserved synteny intervals in the mouse (http://www.ncbi.nlm.nih.gov/Homology ). The black rectangle shows the position of the ∼1.8-Mb CFTR interval, and the red rectangle highlights the position of ST7 in this region. This map was constructed using NCBI build 28 and the MGI composite map. The order of the loci presented is based on the human reference sequence. The indicated mouse loci are not consecutive based on their MGI cM positions (Tes 1.5 cM, Met 4.0 cM, Cappa2 3.05 cM, Wnt2 4.2 cM, Cftr 3.1 cM, and Kend2 7.2 cM). The curvy line between Tcfec and Tes represents a conserved synteny breakpoint between humans and mice. The following NCBI links are provided: STS links are linked to the dbSTS pages, human cytogenetic positions are linked to NCBI's MapViewer, gene symbols are linked to LocusLink, the Bl2_seq links provide an alignment of two representative transcripts using Blast2Seq, and genetic positions (cM) are linked to the NCBI's Mapviewer.
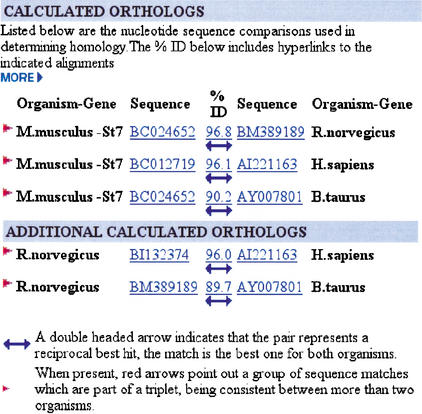
HomoloGene calculated reciprocal best match analysis between the mouse (M. musculus), human (H. sapiens), rat (R. norvegicus), and cow (B. taurus) ST7 genes. In the HomoloGene Calculated Orthologs section, a double-headed arrow indicates that the pairwise alignment represents a reciprocal best match between the indicated species. The red arrow indicates that the sequence matches are part of a triplet, being consistent between more than two species. When a pair of genes is part of a triplet relationship, the other members of the triplet are shown in the Additional Calculated Orthologs section. The accession numbers are hyperlinked to the GenBank entry, and the arrow and identity score are linked to a BLAST alignment of the two sequences.
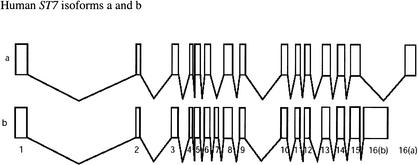
The human ST7 locus on 7q31 produces two transcripts. Isoform a is shorter in length than isoform b due to the fact that it is missing the alternatively spliced exon 7 and has a shorter length 3′-end exon. The two isoforms, a and b, each have their own NCBI accession numbers, NM_018412 and NM_021908, respectively.
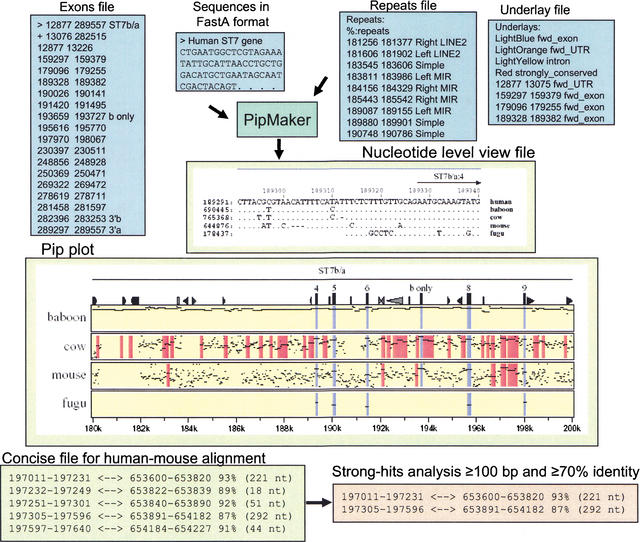
PipMaker: input and output files. Files for submission to PipMaker include Sequences (required), Repeats (recommended), Underlay (optional), and Exon annotations (optional). The Repeats file is made by simplifying RepeatMasker output using the program rmask2repeats (from the PipTools program package). The simplified version is shown. The coordinates in the Repeats file and Underlay file correspond to the coordinates in the Pip plot. PipMaker generates three multiple output files. The Pip plot shown is a subregion of the human ST7 interval compared with the orthologous baboon, cow, mouse, or fugu sequences. Each panel represents a pairwise comparison between human sequence and that of the indicated species. Each alignment consists of a series of horizontal lines that represent the gap-free aligning segments that are graphed on a vertical scale of 50%–100% and relative to the coordinates in the human sequence on the horizontal axis. Icons across the top panel represent annotations for the reference human sequence and include triangles for various repeats and rectangles for exons and CpG islands. The names of gene (ST7) and direction of transcription are indicated above the alignments. The Nucleotide-Level View shows the multiple alignment of the multispecies comparison at the nucleotide level. Dots represent nucleotides that are the same. Dashes represent gaps. The interval shown includes ST7 exon sequences, and thus some nucleotides are conserved between humans and fugu. The Concise output gives a coordinate-based format of the aligning segments. The gap-free interval in the first sequence and the corresponding interval in the second sequence are listed, along with the percent identity and length. The program strong-hits reads the concise file format and returns alignments that fulfill user-specified thresholds (length of the alignment and the percent identity).
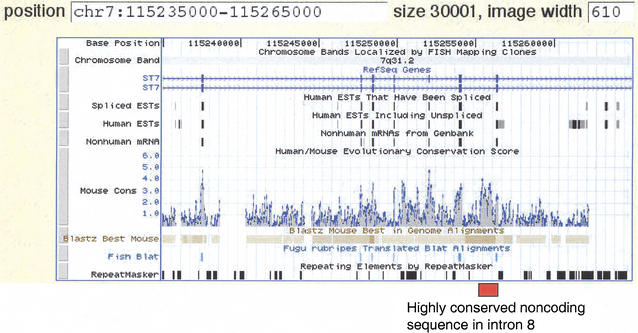
UCSC Genome Browser view of the human–mouse sequence alignment in the ST7 region. The Browser tracks provide different types of information on the ST7 gene, in this case showing the region from exon 3 through exon 9, as thin rectangles on the track beneath “RefSeq Genes“. The two diagrams for ST7 represent the two isoforms, a and b. The direction of transcription is indicated by the light blue arrows. The next three tracks (Spliced ESTs, Human ESTs, Nonhuman mRNAs) show evidence of transcription into stable mRNA. The Mouse Cons track plots a log-likelihood score that gives the probability that an aligned segment is under selection, adjusted for the neutral substitution rate measured in nearby ancestral repeats. The positions of blastz alignments are plotted on the Blastz Best Mouse track, and nucleotide-level alignments can be obtained by clicking on this track. Regions that align with Fugu rubripes are shown on the Fish Blat track, followed by repeats as identified by RepeatMasker. The position of the highly conserved noncoding sequence in intron 8 of ST7 is indicated by the red box. Note that it has a score on the MouseCons track of 4.0, meaning that it is 10,000 times more likely to be under selection than to be under evolutionary drift.
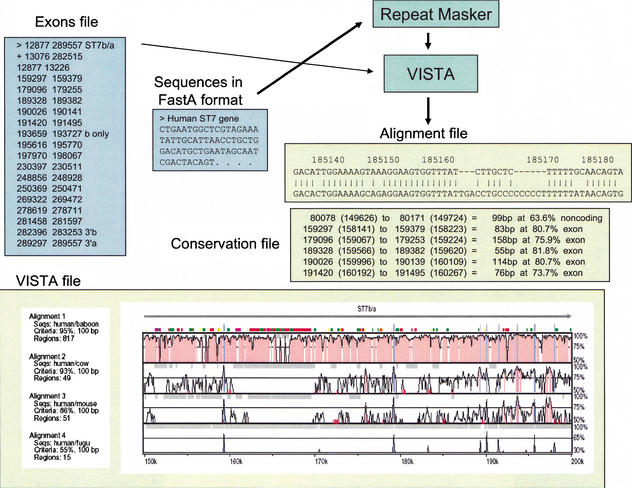
VISTA: input and output files. Files for submission to VISTA include Sequences (required) and Exons (optional). Repeats are masked in the reference sequence using RepeatMasker upon its submission to VISTA. VISTA generates three output files. The VISTA plot shown here is a subregion of the human ST7 interval compared with the orthologous baboon, cow, mouse, or fugu sequences. Conserved sequences represented as peaks [noncoding (red) and coding (blue)] are shown relative to their positions in the human genome (horizontal axes), and their percent identities (50%–100%) are indicated on the vertical axes. The locations of ST7 exons are indicated by tall blue rectangles, and the direction of transcription is indicated by a horizontal arrow. The locations of repetitive elements are indicated by color rectangles (see Suppl. Fig. 2). The Alignment file shows the alignment between the human reference sequence and the orthologous mouse DNA; coordinates correspond to the positions in the human sequence shown in the VISTA plot. The Conservation file gives the coordinates of the conserved sequences at predefined cutoffs.
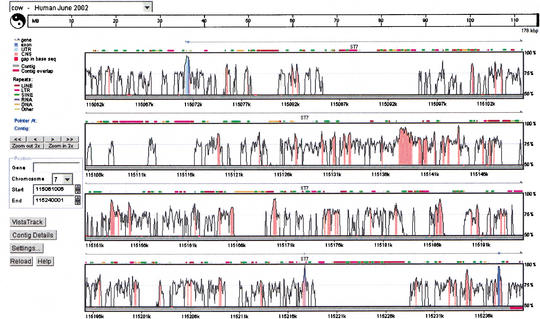
VISTA Genome Browser display generated by the submission of the cow ST7 genomic sequence to the GenomeVista server. The cow ST7 sequence is automatically aligned against the orthologous human region (June 2002 assembly). Details of the display including chromosome and nucleotide position of the sequence alignment are given in the legend on the left-hand side of the plot. The ‘Contig Details’ button opens another window that provides access to files of nucleotide-level alignment, individual sequences in the alignment, corresponding RefSeq annotation, conserved regions, and other results. The ‘Settings’ button brings up a window where a user can customize a cutoff for calculating conservation level (percent identity and the window size) and many display options, such as image format.
References
-
- Aparicio S., Chapman, J., Stupka, E., Putnam, N., Chia, J.M., Dehal, P., Christoffels, A., Rash, S., Hoon, S., Smit, A., et al. 2002. Whole-genome shotgun assembly and analysis of the genome of Fugu rubripes. Science 297: 1283-1285. - PubMed
-
- Burge C. and Karlin, S. 1997. Prediction of complete gene structures in human genomic DNA. J. Mol. Biol. 268: 78-94. - PubMed
Publication types
MeSH terms
Substances
Grants and funding
LinkOut - more resources
Full Text Sources
Other Literature Sources