Comparative Study
. 2003 Jan;13(1):13-26.
doi: 10.1101/gr.844103.

Covariation in frequencies of substitution, deletion, transposition, and recombination during eutherian evolution

Affiliations
Comparative Study

Covariation in frequencies of substitution, deletion, transposition, and recombination during eutherian evolution

Ross C Hardison et al. Genome Res. 2003 Jan.

Abstract

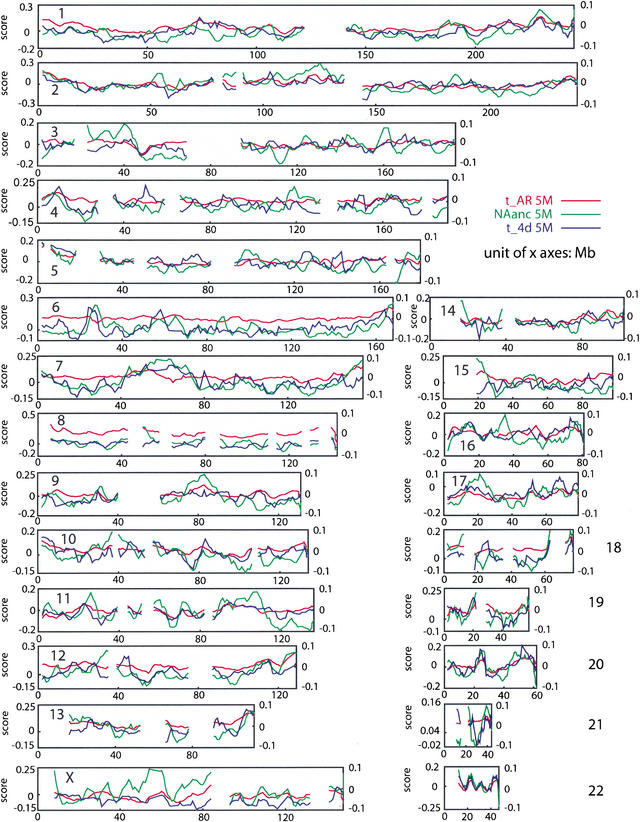
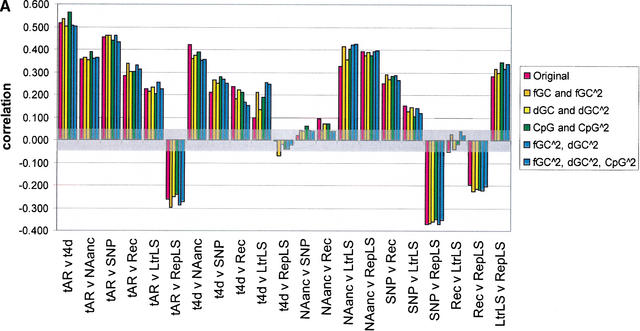
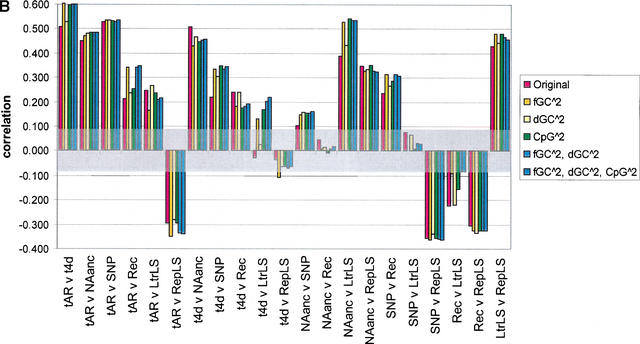
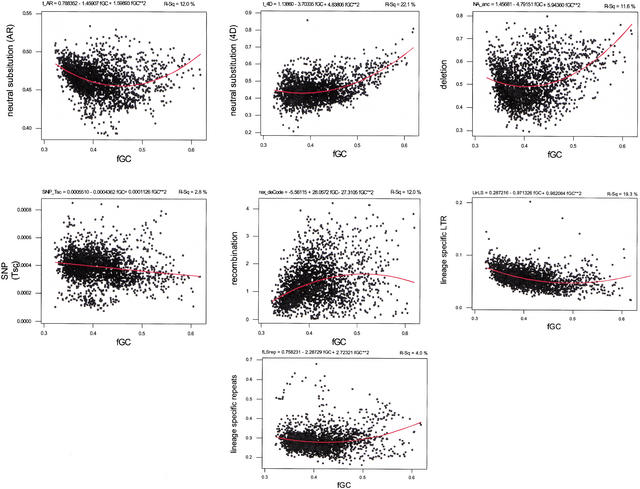
Six measures of evolutionary change in the human genome were studied, three derived from the aligned human and mouse genomes in conjunction with the Mouse Genome Sequencing Consortium, consisting of (1) nucleotide substitution per fourfold degenerate site in coding regions, (2) nucleotide substitution per site in relics of transposable elements active only before the human-mouse speciation, and (3) the nonaligning fraction of human DNA that is nonrepetitive or in ancestral repeats; and three derived from human genome data alone, consisting of (4) SNP density, (5) frequency of insertion of transposable elements, and (6) rate of recombination. Features 1 and 2 are measures of nucleotide substitutions at two classes of "neutral" sites, whereas 4 is a measure of recent mutations. Feature 3 is a measure dominated by deletions in mouse, whereas 5 represents insertions in human. It was found that all six vary significantly in megabase-sized regions genome-wide, and many vary together. This indicates that some regions of a genome change slowly by all processes that alter DNA, and others change faster. Regional variation in all processes is correlated with, but not completely accounted for, by GC content in human and the difference between GC content in human and mouse.


Figures

Figure 1.
Figure 1.
Variation in neutral substitution rates (tAR and t4D) and fraction not aligning (NAanc, determined largely by deletions) for 22 autosomes and the X-chromosome. Values for these functions in windows of 5 Mb are plotted and shifted by 1 Mb between windows. After removing the quadratic effect of fraction GC for each variable, the residuals of tAR are plotted as the red line (values on right vertical axis), of t4D as the blue line, and of NAanc as the green line (values for residuals of t4D and NAanc on left vertical axis). Only windows with at least 800 4D sites were used in the graphs for tAR and t4D, respectively, leading to the discontinuities in the lines, in addition to sequence gaps.
Figure 2.
Figure 2.
Variation in t4D, tAR, tintron, tcoding, t3′UTR, and t5′UTR along human Chromosome 22 (A) and residuals of t4D, tAR, tintron, tcoding, t3′UTR, and t5′UTR after quadratic regressions on human CG content along human Chromosome 22 (B). All values were calculated from 5-Mb overlapping by 4-Mb windows of the human–mouse alignment and were normalized using the genome-wide mean and standard deviation (denoted by superscript + in A and * in B). The normalization was done to ensure that all values have the same dynamic range.
Figure 3.
Figure 3.
Variation in the fraction aligning with mouse, lineage-specific repeats and inferred deletions in mouse for the human chromosomes. For each human autosome and the X-chromosome, the amount of sequence aligned with mouse was computed. The aligning DNA was separated into two categories; the fraction of sequenced bases in alignments not including gaps (i.e., matches and mismatches) is plotted in blue (alnNGA), and the fraction of bases in gaps within alignments is plotted in orange (alnIAG). The fraction of sequenced bases on each chromosome in lineage-specific repeats (RepLS) is plotted in red. The sequenced bases not in lineage-specific repeats (i.e., nonrepetitive DNA plus ancestral repeats) are considered the DNA derived from the last common ancestor to mouse and human; these are the bases potentially able to align with mouse. The fraction of the nonrepetitive DNA plus ancestral repeats in each chromosome that does not align with mouse is plotted in green (NAanc). This measure is likely dominated by deletions in mouse.
Figure 4.
Figure 4.
Pairwise correlations for various divergence measures, before and after correcting for the effect of GC content, difference in GC content between human and mouse, and CpG density in human. The seven divergence measures are neutral substitution rates in ancestral repeats (tAR, noted as tAR in the graph) and 4D sites (t4D, noted as t4d in the graph), deletion proxied by NAanc, SNP density, recombination rate (Rec), and insertion proxied by density of lineage specific LTR repeats (LtrLS) and density of lineage-specific repeats in general (RepLS). Correlations are plotted as bars for (1) original divergence measures (in red); (2) residuals from quadratic regressions on GC content (the regression terms are a constant intercept, fGC and fGC squared) (in gold, noted in the key as fGC2); (3) residuals from quadratic regressions on change in GC content between human and mouse (the regression terms are a constant intercept, dGC and dGC squared) (in yellow, noted in the key as dGC2); (4) residuals from quadratic regressions on CpG density (the regression terms are a constant intercept, CpG density and CpG density squared) (in green, noted in the key as CpG2); (5) residuals from quadratic regressions on GC content and difference in GC content between human and mouse (the regression terms are a constant intercept, fGC, fGC squared, dGC, and dGC squared) (in lighter blue, noted in the key as fGC2, dGC2); and (6) residuals from quadratic regressions on GC content, difference in GC content between human and mouse, and CpG density in humans (in darker blue, noted in the key as fGC2, dGC2, CpG2) (A) The results for 1-Mb nonoverlapping windows; (B) the results for 5-Mb nonoverlapping windows. A transparent gray rectangle encompasses correlations for which the p-values fall above 0.050 (i.e., a correlation that is not significant at the 5% Type-I error level).
Figure 4.
Figure 4.
Pairwise correlations for various divergence measures, before and after correcting for the effect of GC content, difference in GC content between human and mouse, and CpG density in human. The seven divergence measures are neutral substitution rates in ancestral repeats (tAR, noted as tAR in the graph) and 4D sites (t4D, noted as t4d in the graph), deletion proxied by NAanc, SNP density, recombination rate (Rec), and insertion proxied by density of lineage specific LTR repeats (LtrLS) and density of lineage-specific repeats in general (RepLS). Correlations are plotted as bars for (1) original divergence measures (in red); (2) residuals from quadratic regressions on GC content (the regression terms are a constant intercept, fGC and fGC squared) (in gold, noted in the key as fGC2); (3) residuals from quadratic regressions on change in GC content between human and mouse (the regression terms are a constant intercept, dGC and dGC squared) (in yellow, noted in the key as dGC2); (4) residuals from quadratic regressions on CpG density (the regression terms are a constant intercept, CpG density and CpG density squared) (in green, noted in the key as CpG2); (5) residuals from quadratic regressions on GC content and difference in GC content between human and mouse (the regression terms are a constant intercept, fGC, fGC squared, dGC, and dGC squared) (in lighter blue, noted in the key as fGC2, dGC2); and (6) residuals from quadratic regressions on GC content, difference in GC content between human and mouse, and CpG density in humans (in darker blue, noted in the key as fGC2, dGC2, CpG2) (A) The results for 1-Mb nonoverlapping windows; (B) the results for 5-Mb nonoverlapping windows. A transparent gray rectangle encompasses correlations for which the p-values fall above 0.050 (i.e., a correlation that is not significant at the 5% Type-I error level).
Figure 5.
Figure 5.
Segments of DNA that accumulate many repetitive elements also have less nonrepetitive, noncoding DNA that aligns with mouse. The correlation between NAanc and density of lineage-specific interspersed repeats (RepLS) was measured for human Chromosome 22, using 10-kb overlapping windows with 1-base increments. The overall correlation is r = 0.3353. An empirical P-value was evaluated by performing 100 independent randomizations of the positions of the repeats, while keeping the alignments constant. Local correlations were also computed in the 10-kb sliding windows, for the original data and the 100 randomizations. The blue line represents the histogram of local correlations on the original data, whereas the frequencies of local correlations from the 100 randomizations are summarized by their median curve (dotted line) and envelopes of different shades of brown (50% darkest, 80% lighter, and 100% lightest).
Figure 6.
Figure 6.
Quadratic fits on GC content for two measures of neutral substitution (tAR and t4D), a proxy for deletion (NAanc), polymorphisms (SNPtsc), recombination rate, and two measures of insertion of lineage-specific repeats in human (LtrLS and RepLS).

References

    1. Ansari-Lari M.A., Oeltjen, J.C., Schwartz, S., Zhang, Z., Muzny, D.M., Lu, J., Gorrell, J.H., Chinault, A.C., Belmont, J.W., Miller, W., et al. 1998. Comparative sequence analysis of a gene-rich cluster at human chromosome 12p13 and its syntenic region in mouse chromosome 6. Genome Res. 8: 29-40. - PubMed
    1. Archibald J.D., Averianov, A.O., and Ekdale, E.G. 2001. Late Cretaceous relatives of rabbits, rodents, and other extant eutherian mammals. Nature 414: 62-65. - PubMed
    1. Begun D.J. and Aquadro, C.F. 1992. Levels of naturally occurring DNA polymorphism correlate with recombination rates in D. melanogaster. Nature 356: 519-520. - PubMed
    1. Bernardi G. 1986. Compositional constraints and genome evolution. J. Mol. Evol. 24: 1-11. - PubMed
    1. ___, 1993. The isochore organization of the human genome and its evolutionary history—A review. Gene 135: 57-66. - PubMed

Publication types

Substances

LinkOut - more resources