Comparative Study
. 2003 Jan;13(1):122-33.
doi: 10.1101/gr.858103.

The comprehensive mouse radiation hybrid map densely cross-referenced to the recombination map: a tool to support the sequence assemblies

Affiliations
Comparative Study

The comprehensive mouse radiation hybrid map densely cross-referenced to the recombination map: a tool to support the sequence assemblies

Lucy B Rowe et al. Genome Res. 2003 Jan.

Abstract

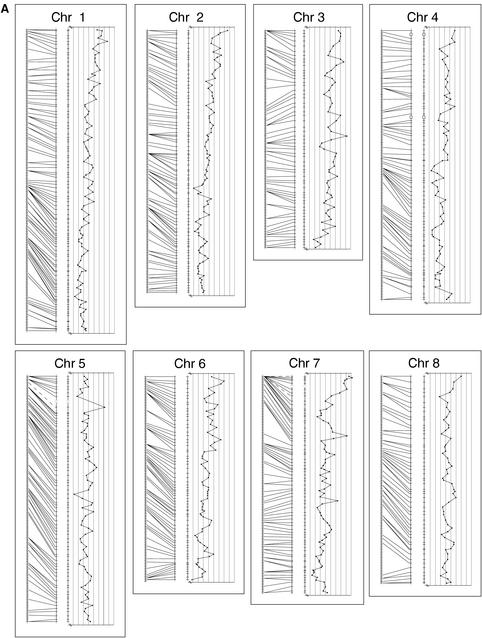
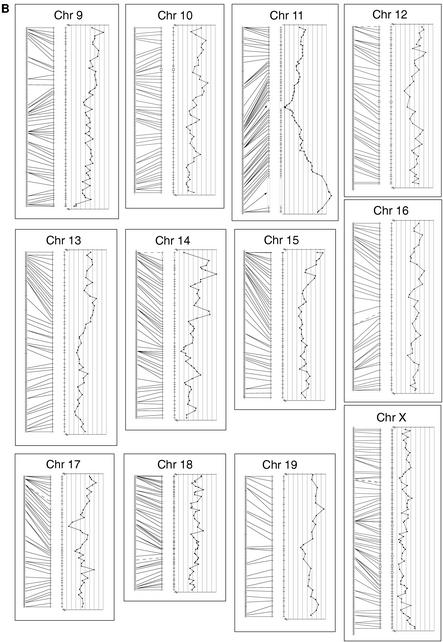
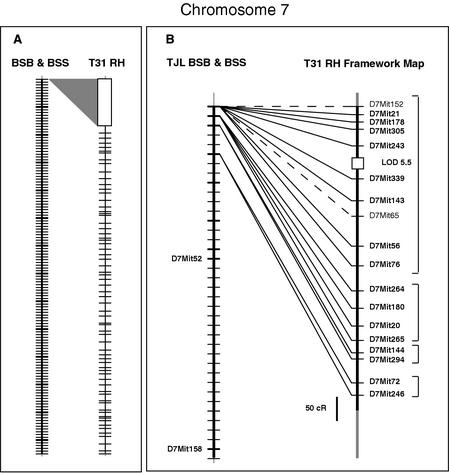
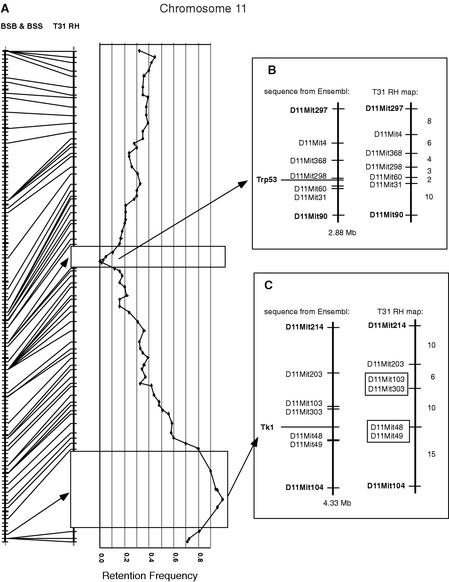
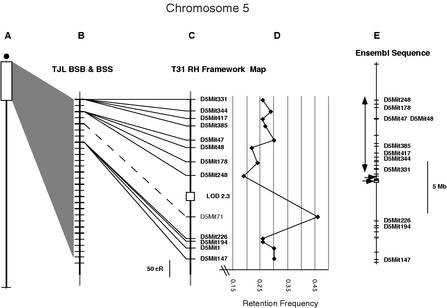
We have developed a unique comprehensive mouse radiation hybrid (RH) map of nearly 23,000 markers integrating data from three international genome centers and over 400 independent laboratories. We have cross-referenced this map to the 0.5-cM resolution recombination-based Jackson Laboratory (TJL) backcross panel map, building a complete set of RH framework chromosome maps based on a high density of known-ordered anchor markers. We have systematically typed markers to improve coverage and resolve discrepancies, and have reanalyzed data sets as needed. The cross-linking of the RH and recombination maps has resulted in a highly accurate genome-wide map with consistent marker order. We have compared these linked framework maps to the Ensemble mouse genome sequence assembly, and show that they are a useful medium resolution tool for both validating sequence assembly and elucidating chromosome biology.


Figures

Figure 1.
Figure 1.
The mouse recombination map linked to the T31 radiation hybrid map: alignment of mapped framework markers in both TJL interspecific backcross maps and T31radiation hybrid maps. All maps are drawn to a uniform cM scale, and the RH maps are set to equal the length of the corresponding recombination map. Thus, the cR scale for each chromosome may differ. The recombination map from the combined TJL BSB/BSS mapping panels is represented on the left. Each tick mark on the recombination map represents a single crossover event; one crossover/188 animals equals 0.56 cM between crossovers. The RH map in the center of each chromosome panel shows the framework markers spaced by the cR distance between each pair of adjacent framework markers based on the data for those two markers only. Missing scores for all markers are inferred if flanking data are concordant. Lines join the two maps where the same framework marker is mapped in both systems. These lines are dashed when the marker is mapped only in the 94 animals of the BSS cross due to failure of the Mus spretus allele to amplify from heterozygotes. Open boxes over the chromosome line indicate intervals whose LOD fails to meet the LOD > 6 criterion for significant linkage (see text for discussion). To the right of each chromosome framework map is graphed the RH retention frequency for each framework marker against its cR position in the map. Note that all retention graphs show the 15%–55% retention range, with the lower retention to the left, except the Chr 11 graph, which shows the range 0%–100% retention frequency.
Figure 1.
Figure 1.
The mouse recombination map linked to the T31 radiation hybrid map: alignment of mapped framework markers in both TJL interspecific backcross maps and T31radiation hybrid maps. All maps are drawn to a uniform cM scale, and the RH maps are set to equal the length of the corresponding recombination map. Thus, the cR scale for each chromosome may differ. The recombination map from the combined TJL BSB/BSS mapping panels is represented on the left. Each tick mark on the recombination map represents a single crossover event; one crossover/188 animals equals 0.56 cM between crossovers. The RH map in the center of each chromosome panel shows the framework markers spaced by the cR distance between each pair of adjacent framework markers based on the data for those two markers only. Missing scores for all markers are inferred if flanking data are concordant. Lines join the two maps where the same framework marker is mapped in both systems. These lines are dashed when the marker is mapped only in the 94 animals of the BSS cross due to failure of the Mus spretus allele to amplify from heterozygotes. Open boxes over the chromosome line indicate intervals whose LOD fails to meet the LOD > 6 criterion for significant linkage (see text for discussion). To the right of each chromosome framework map is graphed the RH retention frequency for each framework marker against its cR position in the map. Note that all retention graphs show the 15%–55% retention range, with the lower retention to the left, except the Chr 11 graph, which shows the range 0%–100% retention frequency.
Figure 2.
Figure 2.
Chromosome 7 framework map showing suppression of recombination near the centromere. All maps are drawn with the centromere at the top. (A) Shows on the left the entire Chr 7 recombination map from TJL BSB/BSS backcrosses with crosshatches for each crossover and heavy crosshatches every 10 crossovers. A gray triangle shows the proportion of the T31 RH framework map that is nonrecombinant at the proximal end of the backcross map. (B) Shows greater detail of this proximal region of the backcross and RH maps. Heavy crosshatches on TJL BSB/BSS chromosome figure indicate positions of framework markers. Brackets on the right indicate the groups of markers on the RH map that fail to recombine in the backcross. Locus symbols in plain text indicate markers that are mapped only in the 94 animals of the BSS cross due to failure of the Mus spretus allele to amplify in heterozygotes. An interval of LOD less than 6 is indicated with an open box over the RH chromosome line. Note that all locus symbols should be printed in italics, but are shown here in plain text for readability.
Figure 3.
Figure 3.
Chromosome 11 framework map (A) showing two gaps in significant linkage due to extreme retention frequencies of markers. TJL BSB/BSS combined backcross map is shown on the left, with crosshatches at each crossover (0.56 cM) and heavier crosshatches every 10 crossovers. Lines join this map to the framework map of Chromosome 11 in the T31 RH data. RH markers are placed at their cR positions. Where the LOD of linkage drops below 6 (minimum significant LOD), an open rectangle is drawn across the RH chromosome line, with the flanking markers at their calculated cR distance apart. Within these low LOD intervals the marker spacing is drawn proportional to the minimum number of obligate segment breaks in each interval. Graphed on the right of (A) is the retention frequency for each framework marker, with x-axis intervals of 10%. The lowest retention frequency is zero and the highest is 100%. The presumed selected markers are assigned a retention rate of Trp53 = 0% and Tk1 = 100%. (B,C) The low-LOD intervals compared to sequence from Ensembl v3. Sequence maps are drawn to Mb scale. RH maps are set at the same length as the sequence map and RH distances are set proportional to the minimum number of obligate segment breaks in each interval. Numbers to the right of the RH map bars are number of breaks in the interval. Bold locus symbols indicate markers that link with significant LOD to the rest of the chromosome RH data. Plain text locus symbols indicate markers that have interlocus LODs less than 6. Presumed selected marker is shown in bold out to the left of each sequence.
Figure 4.
Figure 4.
Proximal Chromosome 5 compared to the Ensembl v3 sequence assembly. (A) Shows the portion of the Chr 5 map detailed in the rest of the figure. (B) Shows TJL BSB/BSS backcross recombination map, with crosshatches for each crossover and heavier crosshatches for each position that contains a framework marker. (C) The T31 RH framework map for this proximal region. A 50-cR scale bar is included to the left of the chromosome line. Note that there are four markers that cosegregate at the top of the recombination map and another four that map two crossovers distally. D5Mit71, shown in plain text with a dashed line joining the maps, could only be mapped in the BSS cross, and its BSB position is estimated from data based on reading copy number of C57BL/6J alleles. The backcross mapping places this marker clearly proximal to D5Mit226 and D5Mit194. (D) The retention frequency graph for this part of Chr 5 shows the unusually high retention of the D5Mit71 marker that causes it to link poorly to the surrounding data. (E) The Ensembl v3 sequence assembly for this region. The sequence is shown to Mb scale (a 5-Mb scale bar is included to the right of the figure), with crosshatches for each MIT SSLP marker annotated in the sequence. Right-pointing arrows indicate gaps in the contig. The vertical double-headed arrow shows the region that is in inverted order relative to the recombination/RH map.

Similar articles

Cited by

References

    1. Arkell R.M., Cadman, M., Marsland, T., Southwell, A., Thaung, C., Davies, J.R., Clay, T., Beechy, C.V., Evans, E.P., Strivens, M.A., et al. 2001. Genetic, physical, and phenotypic characterization of the Del13Svea36H mouse. Mamm. Genome 12: 687-694. - PubMed
    1. Avner P., Bruls, T., Poras, I., Eley, L., Gas, S., Ruiz, P., Wiles, M.V., Sousa-Nunes, R., Kettleborough, R., Rana, A., et al. 2001. A radiation hybrid transcript map of the mouse genome. Nat. Genet. 29: 194-200. - PubMed
    1. Behboudi A., Roshani, L., Lundin, L., Stahl, F., Levan, K.K., and Levan, G. 2002. The functional significance of absence: The chromosomal segment harboring Tp53 is absent from the T55 rat radiation hybrid mapping panel. Genomics 79: 844-848. - PubMed
    1. Broman K.W., Rowe, L.B., Churchill, G.A., and Paigen, K. 2001. Crossover interference in the mouse. Genetics 160: 1123-1131. - PMC - PubMed
    1. Copeland N.G., Jenkins, N., Gilbert, D., Eppig, J.T., Maltais, L.J., Miller, J.C., Dietrich, W.F., Weaver, A., Lincoln, S.E., Steen, R.G., et al. 1993. A genetic linkage map of the mouse: Current applications and future prospects. Science 262: 57-66. - PubMed

Publication types

LinkOut - more resources