. 2003 Feb;23(3):1085-94.
doi: 10.1128/MCB.23.3.1085-1094.2003.

Mitochondrial biogenesis and remodeling during adipogenesis and in response to the insulin sensitizer rosiglitazone

Affiliations

Mitochondrial biogenesis and remodeling during adipogenesis and in response to the insulin sensitizer rosiglitazone

Leanne Wilson-Fritch et al. Mol Cell Biol. 2003 Feb.

Abstract

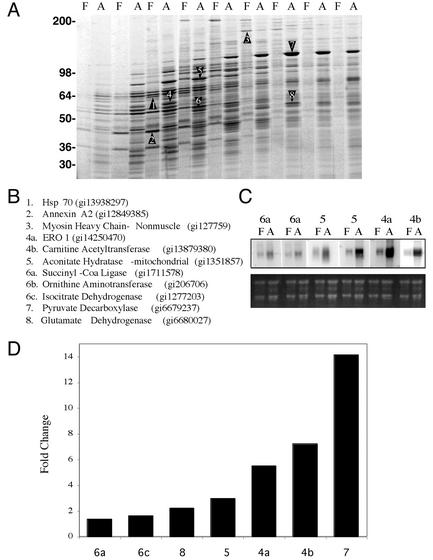
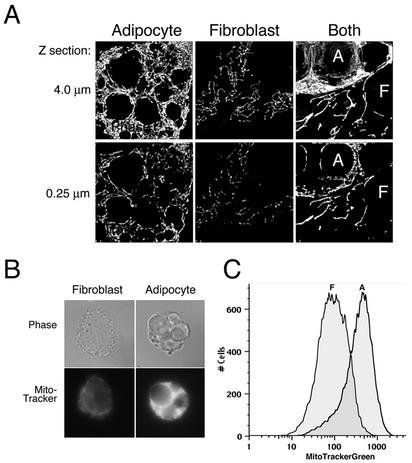
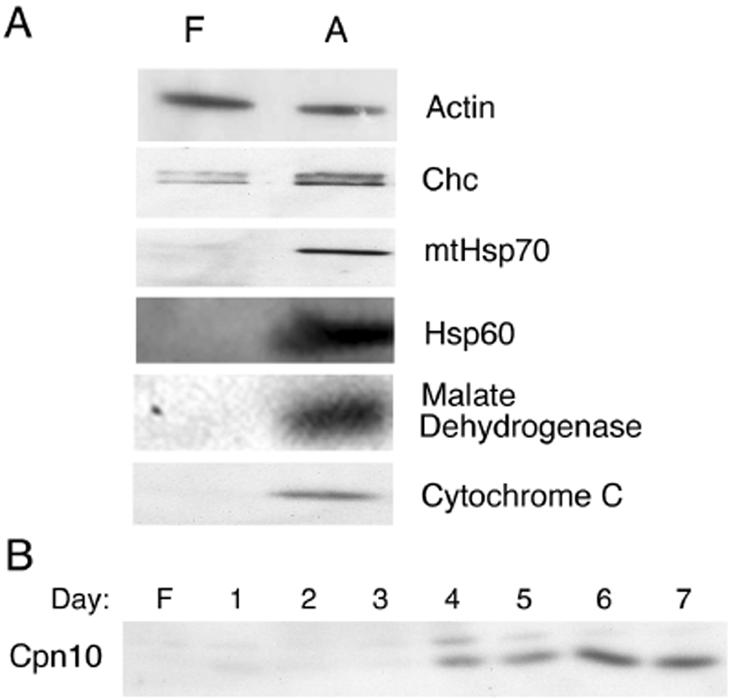
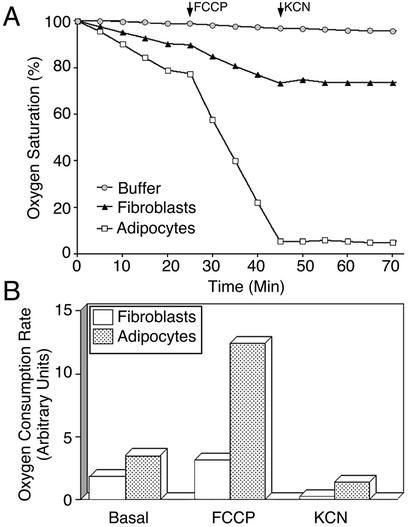
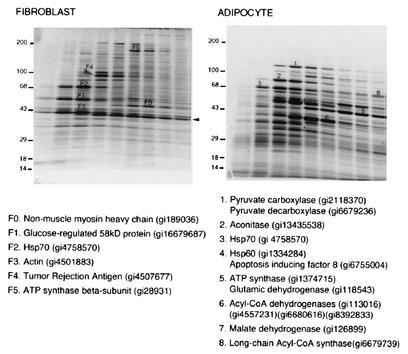
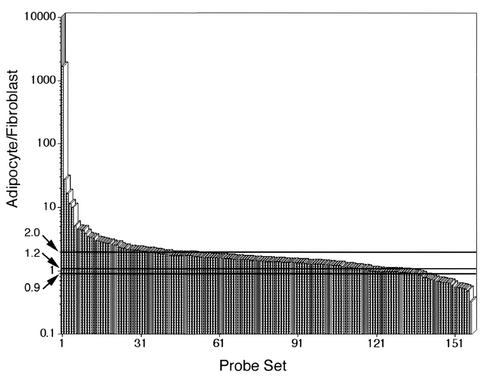
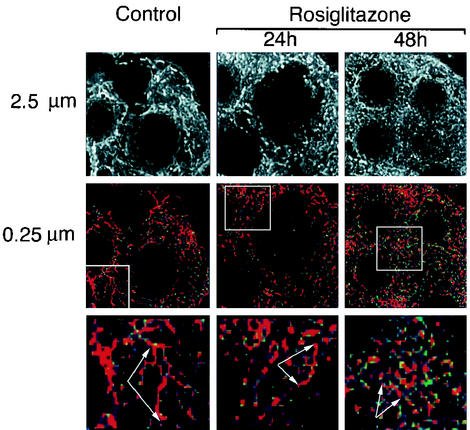
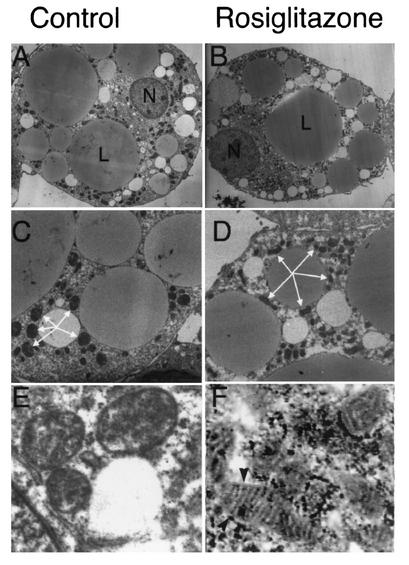
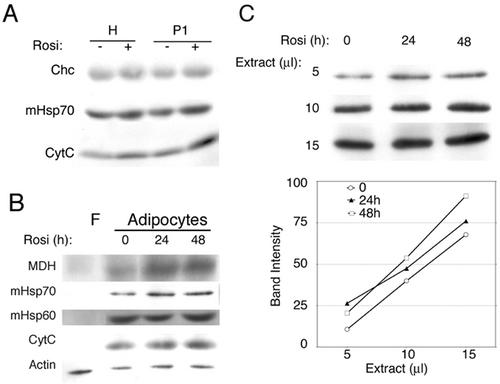
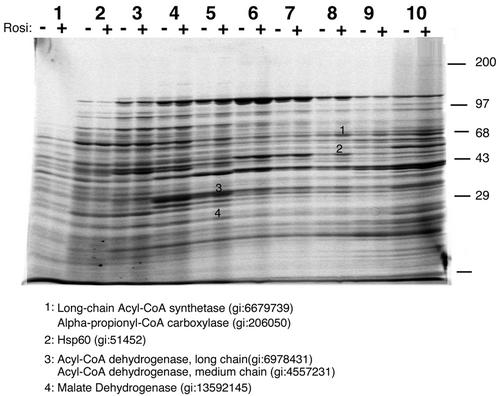
White adipose tissue is an important endocrine organ involved in the control of whole-body metabolism, insulin sensitivity, and food intake. To better understand these functions, 3T3-L1 cell differentiation was studied by using combined proteomic and genomic strategies. The proteomics approach developed here exploits velocity gradient centrifugation as an alternative to isoelectric focusing for protein separation in the first dimension. A 20- to 30-fold increase in the concentration of numerous mitochondrial proteins was observed during adipogenesis, as determined by mass spectrometry and database correlation analysis. Light and electron microscopy confirmed a large increase in the number of mitochondrion profiles with differentiation. Furthermore, mRNA profiles obtained by using Affymetrix GeneChips revealed statistically significant increases in the expression of many nucleus-encoded mitochondrial genes during adipogenesis. Qualitative changes in mitochondrial composition also occur during adipose differentiation, as exemplified by increases in expression of proteins involved in fatty acid metabolism and of mitochondrial chaperones. Furthermore, the insulin sensitizer rosiglitazone caused striking changes in mitochondrial shape and expression of selective mitochondrial proteins. Thus, although mitochondrial biogenesis has classically been associated with brown adipocyte differentiation and thermogenesis, our results reveal that mitochondrial biogenesis and remodeling are inherent to adipose differentiation per se and are influenced by the actions of insulin sensitizers.


Figures

FIG. 1.
FIG. 1.
Analysis of protein and mRNA composition in 3T3-L1 cells prior to and after differentiation. (A) A crude postnuclear fraction from confluent 3T3-L1 fibroblasts (lanes F) and 3T3-L1 adipocytes 7 days after differentiation (lanes A) was obtained and then centrifuged for 15 min at 300,000 × g, and the resulting pellets were solubilized in CHAPS as described in Materials and Methods. Extracts were subjected to velocity centrifugation and fractionated into 10 fractions from the top. Aliquots from each fraction were analyzed side by side on a 7.5 to 15% polyacrylamide gel, which was stained with Sypro Ruby. Bands identified by numbers from both fibroblast and adipocytes were excised and identified by mass spectrometry and database correlation analysis. (B) Identities and gene identifier numbers from the excised bands. (C) Northern blot analysis of mRNAs for selected bands. The lower panel is total RNA. (D) Fold change in gene expression for selected bands observed by Affymetrix GeneChip analysis.
FIG. 2.
FIG. 2.
Adipocyte differentiation is accompanied by increasing mitochondrial mass as assessed by using a mitochondrion-specific dye. (A) 3T3-L1 cells were analyzed at confluence (fibroblast) and after 7 days after differentiation (adipocyte). The rightmost panels illustrate a field from a coverslip in which both cell types were seeded to compare within the same field. A fraction from an adipocyte occupies the top left half of the field (A), whereas a fibroblast adjacent to the adipocyte occupies the bottom right (F). Cells were incubated with 100 nM MitoTracker Green FM for 40 min, and optical sections were acquired from the bottom to the top of the cell, spaced at 250 nm. The haze originating from light sources outside the in-focus plane of the cell was reduced by image restoration. Sixteen sections encompassing 4 μm from the bottom to the top of the cell were projected into single two-dimensional images (top panels). A single 0.25-μm optical section is also shown (lower panels). (B) Cells were treated with trypsin prior to incubation with MitoTracker Green FM for 40 min, after which they were allowed to settle on coverslips prior to fixation. Top panels represent the phase image, and bottom panels show the fluorescence image acquired on a regular wide-field microscope. (C) Fluorescence-activated cell sorting analysis of fibroblasts (F) and adipocytes (A) stained with MitoTracker Green FM.
FIG. 3.
FIG. 3.
Increased expression of mitochondrial proteins with differentiation. (A) 3T3-L1 cells were analyzed at confluence (lanes F) and at 7 days after differentiation [lanes A]. Cells were solubilized into SDS sample buffer. Equal amounts of total protein were separated by SDS-PAGE and then analyzed by Western blotting with antibodies against actin, clathrin heavy-chain (Chc), mitochondrial Hsp70, mitochondrial Hsp60, malate dehydrogenase, and cytochrome c. (B) Time course of mitochondrial protein expression after the indicated days of differentiation as assessed by Western blotting with antibody to chaperonin 10 (Cpn10).
FIG. 4.
FIG. 4.
Comparative analysis of oxygen consumption in 3T3-L1 fibroblasts and adipocytes. (A) Oxygen consumption of 3T3-L1 fibroblasts (▴) and adipocytes (□) was performed by using a Clark-type oxygen electrode. Approximately 106 cells were incubated in a respiratory chamber at 37°C in Krebs Ringer solution buffered with HEPES and 0.5% BSA. At the indicated time points, either 10 nM FCCP or 2 mM KCN was added to each chamber. A control chamber containing buffer only was also included to control for drift as indicated. Oxygen was measured as the percentage of total oxygen in the chamber at the start of the experiment, which was set at 100%. (B) Changes in the respiratory rate of fibroblasts and adipocytes during each condition were calculated by determining the change in oxygen concentration in the respiratory chamber between the 5- and 15-min time points.
FIG. 5.
FIG. 5.
Mitochondrial remodeling during adipose differentiation. Mitochondria were isolated and purified from 3T3-L1 fibroblasts and adipocytes, solubilized in CHAPS, and subjected to velocity centrifugation on 10 to 30% sucrose gradients. Gradient fractions were resolved by SDS-PAGE on 7.5 to 15% polyacrylamide gels and stained with Sypro Ruby protein stain. Some of the major bands from the fibroblast (bands F0 to F5) and adipocyte (bands 1 to 7) samples were excised and subjected to peptide fingerprinting and database searching. The identities and gene identifier numbers from the selected bands are indicated. The arrow indicates the position of a contaminant protein in this preparation (bovine muscle creatine kinase) present in the buffer during cell lysis.
FIG. 6.
FIG. 6.
Changes in expression of genes for mitochondrial proteins during adipose differentiation. Genes annotated as mitochondrial in databases generated from hybridization of cRNA from 3T3-L1 cells obtained at confluence (fibroblast) or after 7 days of differentiation (adipocytes) to Affymetrix GeneChip murine genome U74A chips were selected. The fold differences in expression were calculated as described in Materials and Methods and are plotted in descending order.
FIG. 7.
FIG. 7.
Imaging of mitochondria in live rosiglitazone-treated cells. On day 7 of differentiation, 3T3-L1 adipocytes were treated with trypsin and then seeded on coverslips. On day 8, the coverslips were either left untreated (control) or treated with 1 μM rosiglitazone for 24 or 48 h. Cells were incubated with 100 nM MitoTracker Green FM and imaged as described in Fig. 4. Images represent 10 optical sections (2.5 μm) projected into a single plane (top panels) or a single optical section through the middle of the cell (middle panels). Images were pseudocolored, and higher-intensity pixel values are displayed in red. Higher magnifications of the areas delineated by the squares are shown in the bottom panels. Arrows point to reticular structures representing mitochondria, which tend to decrease in length in response to rosiglitazone.
FIG. 8.
FIG. 8.
Electron microscopy of rosiglitazone-treated 3T3-L1 adipocytes. On day 8 of differentiation, 3T3-L1 adipocytes were seeded onto coverslips. On day 9, cells (B, D, and F) were treated with rosiglitazone or left untreated (A, C, and E). On day 10 (A to D) or day 11 (E and F), coverslips were fixed and prepared for electron microscopy as described in Materials and Methods. Panels A and B illustrate whole-cell profiles; panels C and D are at a higher magnification, and mitochondrial profiles surrounding one of the lipid droplets are indicated by arrows. Panels E and F are higher-magnification images focusing on single mitochondria, and the arrowheads in panel F point to the lamellar cristae observed in mitochondria from rosiglitazone-treated cells.
FIG. 9.
FIG. 9.
Effect of rosiglitazone on levels of mitochondrial proteins. (A) 3T3-L1 adipocytes were treated for 48 h with rosiglitazone and fractionated as described in Materials and Methods. Equal amounts of protein from the total homogenate (lanes H) or the mitochondrial-nuclear pellet (lanes P1) were analyzed by immunoblotting with antibodies to clathrin heavy chain (Chc), mitochondrial Hsp70, and cytochrome c (CytC). (B) Confluent 3T3-L1 fibroblasts (lane F) or differentiated 3T3-L1 adipocytes (adipocytes) treated without (lane 0) or with rosiglitazone for 24 or 48 h (as indicated above each lane) were lysed into SDS sample buffer. Equal amounts of total protein were analyzed by Western blotting with antibodies to the indicated proteins. MDH, malate dehydrogenase; CytC, cytochrome c. (C) Band intensities from serial dilutions of extracts probed with anti-Hsp70 antibody quantified as described in Materials and Methods.
FIG. 10.
FIG. 10.
Effect of rosiglitazone on mitochondrial protein composition. On day 8 of differentiation, 3T3-L1 adipocytes were either left untreated (−) or were treated with 1 μM rosiglitazone (Rosi) for 24 h (+). Adipocytes were fractionated, and the mitochondria were isolated and solubilized in CHAPS. Equal amounts of mitochondrial protein were subjected to velocity centrifugation on 10 to 30% sucrose gradients, and gradients were fractionated into 10 fractions from the top. The gradient fractions were resolved side by side on a 7.5 to 15% polyacrylamide gel, which was stained with Sypro Ruby. Some of the more abundant bands exhibiting differences between untreated and treated states in two successive experiments (comparison not illustrated) were excised from the gel and subjected to peptide fingerprinting and database searching. The identities and gene identifier numbers from the selected bands are indicated.

References

    1. Abel, E. D., O. Peroni, J. K. Kim, Y. B. Kim, O. Boss, E. Hadro, T. Minnemann, G. I. Shulman, and B. B. Kahn. 2001. Adipose-selective targeting of the GLUT4 gene impairs insulin action in muscle and liver. Nature 409:729-733. - PubMed
    1. Andersson, U., and R. C. Scarpulla. 2001. Pgc-1-related coactivator, a novel, serum-inducible coactivator of nuclear respiratory factor 1-dependent transcription in mammalian cells. Mol. Cell. Biol. 21:3738-3749. - PMC - PubMed
    1. Berggren, K., E. Chernokalskaya, T. H. Steinberg, C. Kemper, M. F. Lopez, Z. Diwu, R. P. Haugland, and W. F. Patton. 2000. Background-free, high sensitivity staining of proteins in one- and two-dimensional sodium dodecyl sulfate-polyacrylamide gels using a luminescent ruthenium complex. Electrophoresis 21:2509-2521. - PubMed
    1. Boden, G., X. Chen, J. Ruiz, J. V. White, and L. Rossetti. 1994. Mechanisms of fatty acid-induced inhibition of glucose uptake. J. Clin. Investig. 93:2438-2446. - PMC - PubMed
    1. Chalkley, S. M., M. Hettiarachchi, D. J. Chisholm, and E. W. Kraegen. 1998. Five-hour fatty acid elevation increases muscle lipids and impairs glycogen synthesis in the rat. Metabolism 47:1121-1126. - PubMed

Publication types

LinkOut - more resources