. 2003 Jan;14(1):214-29.
doi: 10.1091/mbc.e02-08-0499.

Global transcriptional responses of fission yeast to environmental stress

Affiliations

Global transcriptional responses of fission yeast to environmental stress

Dongrong Chen et al. Mol Biol Cell. 2003 Jan.

Abstract

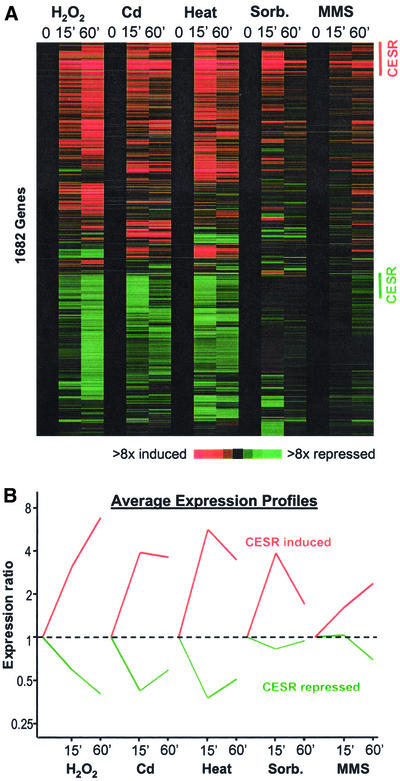
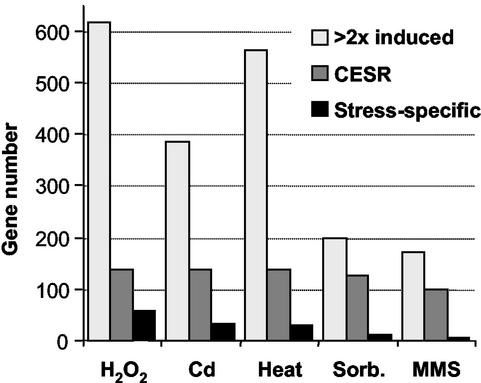
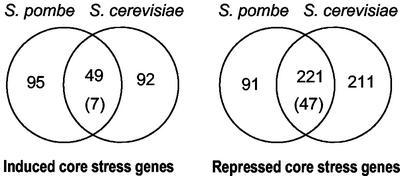
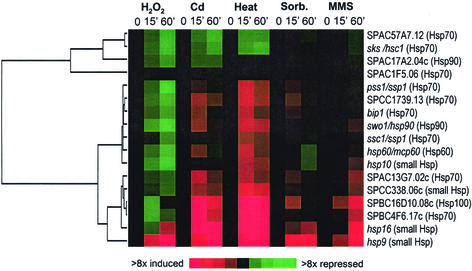
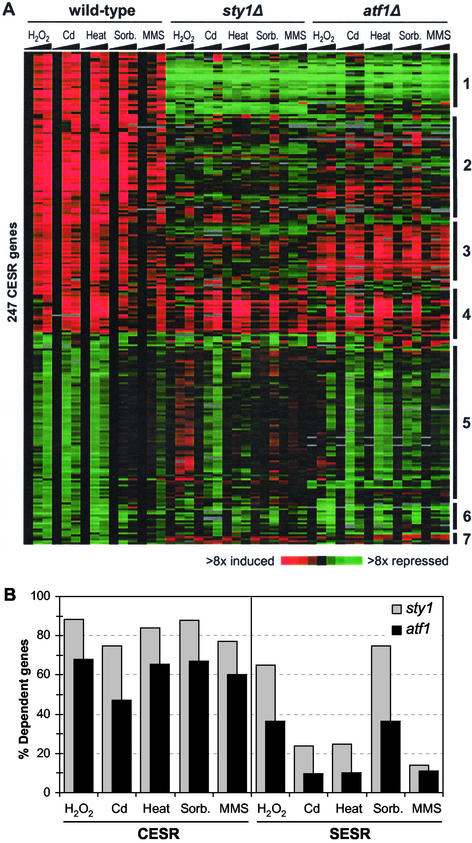
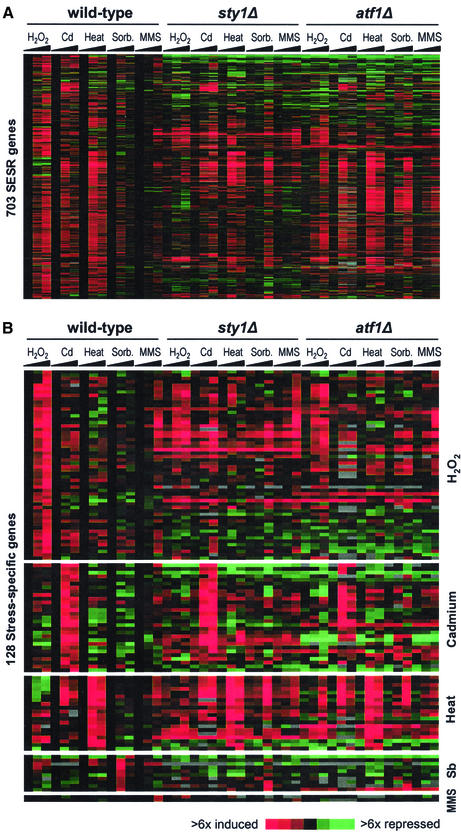
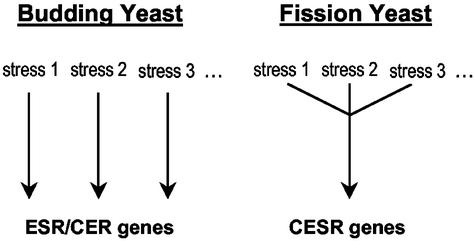
We explored transcriptional responses of the fission yeast Schizosaccharomyces pombe to various environmental stresses. DNA microarrays were used to characterize changes in expression profiles of all known and predicted genes in response to five stress conditions: oxidative stress caused by hydrogen peroxide, heavy metal stress caused by cadmium, heat shock caused by temperature increase to 39 degrees C, osmotic stress caused by sorbitol, and DNA damage caused by the alkylating agent methylmethane sulfonate. We define a core environmental stress response (CESR) common to all, or most, stresses. There was a substantial overlap between CESR genes of fission yeast and the genes of budding yeast that are stereotypically regulated during stress. CESR genes were controlled primarily by the stress-activated mitogen-activated protein kinase Sty1p and the transcription factor Atf1p. S. pombe also activated gene expression programs more specialized for a given stress or a subset of stresses. In general, these "stress-specific" responses were less dependent on the Sty1p mitogen-activated protein kinase pathway and may involve specific regulatory factors. Promoter motifs associated with some of the groups of coregulated genes were identified. We compare and contrast global regulation of stress genes in fission and budding yeasts and discuss evolutionary implications.


Figures

Figure 1
Figure 1
Changes in gene expression in response to five environmental stresses. (A) Approximately seventeen hundred genes whose transcript levels changed significantly by at least twofold in one or more of the stress conditions were hierarchically clustered based on their expression patterns in the five time course experiments (Eisen et al., 1998; see “Materials and Methods”). Horizontal strips represent genes, and columns represent experimental time points. The fold changes in expression, relative to the untreated wild-type sample (time point 0), are color-coded as shown in the bar. The labels on the right indicate CESR induced genes (red; Table 1) and repressed genes (green) that were chosen based on conservative criteria as described in “Materials and Methods.” (B) Average expression patterns of the CESR-induced (red) and -repressed (green) genes as labeled in A in the five stress conditions.
Figure 2
Figure 2
Induction of gene expression in response to different stresses. The histogram shows the numbers of genes that are induced at least twofold, together with the number of CESR genes and the number of the “stress-specific” genes for each of the five stress experiments. CESR and “stress-specific” genes were determined using criteria described in “Materials and Methods.”
Figure 3
Figure 3
Comparison of core stress genes in fission and budding yeasts. Conserved genes that are part of the CESR (this study) were compared with genes that are part of the ESR and/or CER (Gasch et al., 2000; Causton et al., 2001) using an ortholog table (see “Materials and Methods”). Left side: induced genes; right side: repressed genes. The numbers of overlapping genes between the chosen gene groups are shown in the Venn diagrams (lists available from our website). Only genes with orthologs in the other yeast were included in the comparison. The numbers in brackets represent the overlap expected by chance, given the sizes of the gene sets considered and the total number of 2842 genes with orthologs. The overlaps are highly significant, both for induced genes (P ∼ 2 × 10⁻³⁰) and for repressed genes (P ∼ 9 × 10−131).
Figure 4
Figure 4
Expression profiles of HSPs in response to stress. Seventeen members of the conserved family of HSPs were clustered based on their expression patterns in the five time-course experiments. Details are as described in the legend of Figure 1A. A gene tree (dendrogram) based on similarities in expression across all conditions is shown on the left. Gene names are given at right, together with a classification into major Hsp families (in parentheses).
Figure 5
Figure 5
Regulation of gene expression during stress. (A) The 140 induced and 109 repressed CESR repressed genes as defined in “Materials and Methods” were clustered based on their expression patterns in wild-type, sty1Δ, and atf1Δ cells in response to the five stress conditions. Details are as described in the legend of Figure 1A. Major classes of genes are indicated on the right side (see main text for details). (B) Comparison between the regulation of induced CESR and SESR genes. The histogram shows for each stress the percentages of stress-induced genes that were dependent on Sty1p (gray), as well as the percentages of Sty1p-dependent genes that were also dependent on Atf1p (black). Left side: CESR genes; right side: SESR genes.
Figure 6
Figure 6
Regulation of SESR genes. (A) Approximately seven hundred SESR genes (including “stress-specific” genes) that were twofold or greater up-regulated in fewer than four stress experiments were clustered based on their expression patterns in wild-type, sty1Δ, and atf1Δ cells in response to the five stress conditions. Details are as described in the legend of Figure 1A. (B) One hundred twenty-eight “stress-specific” genes as defined in “Materials and Methods” were clustered based on their expression patterns in wild-type, sty1Δ, and atf1Δ cells in response to the five stress conditions. The stress specificities are indicated on the right side. Details are as described in the legend of Figure 1A.
Figure 7
Figure 7
Regulation of stress genes in budding and fission yeasts. Both yeasts control a similar core group of genes in response to all or most stresses. These genes are mainly regulated by stress-specific mechanisms in budding yeast, whereas in fission yeast, the Sty1p MAPK pathway plays a central role in regulating the responses to different stresses. See main text for discussion.

References

    1. Bilski P, Li MY, Ehrenshaft M, Daub ME, Chignell CF. Vitamin B6 (pyridoxine) and its derivatives are efficient singlet oxygen quenchers and potential fungal antioxidants. Photochem Photobiol. 2000;71:129–134. - PubMed
    1. Brazma A, Jonassen I, Vilo J, Ukkonen E. Predicting gene regulatory elements in silico on a genomic scale. Genome Res. 1998;8:1202–1215. - PMC - PubMed
    1. Causton HC, Ren B, Koh SS, Harbison CT, Kanin E, Jennings EG, Lee TI, True HL, Lander ES, Young RA. Remodeling of yeast genome expression in response to environmental changes. Mol Biol Cell. 2001;12:323–337. - PMC - PubMed
    1. Coleman ST, Fang TK, Rovinsky SA, Turano FJ, Moye-Rowley WS. Expression of a glutamate decarboxylase homologue is required for normal oxidative stress tolerance in Saccharomyces cerevisiae. J Biol Chem. 2001;276:244–250. - PubMed
    1. Cotto JJ, Morimoto RI. Stress-induced activation of the heat-shock response: cell and molecular biology of heat-shock factors. Biochem Soc Symp. 1999;64:105–118. - PubMed

Publication types

MeSH terms