

ARAMEMNON, a novel database for Arabidopsis integral membrane proteins
- PMID: 12529511
- PMCID: PMC166783
- DOI: 10.1104/pp.011577
ARAMEMNON, a novel database for Arabidopsis integral membrane proteins
Abstract
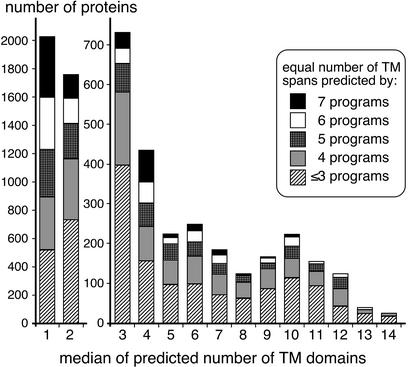
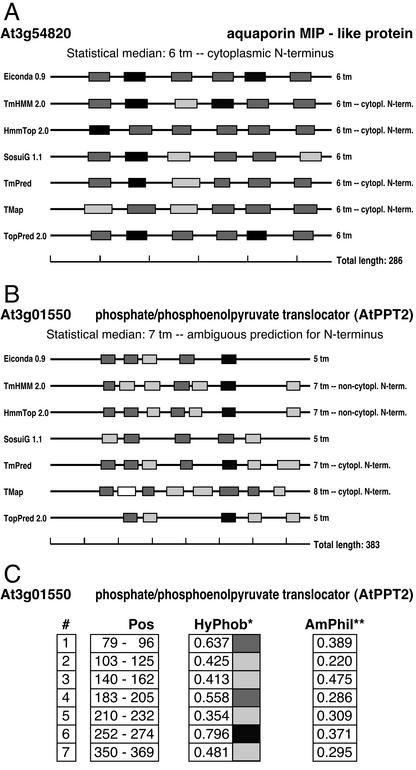
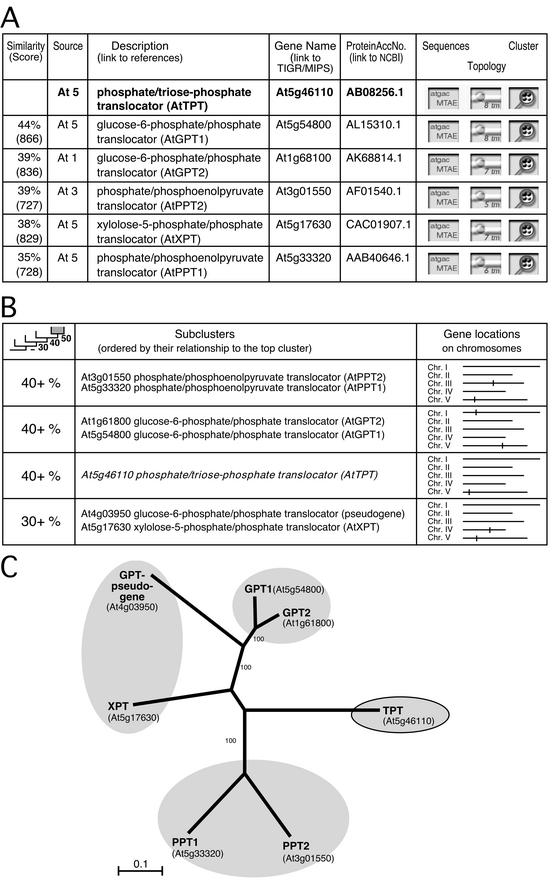
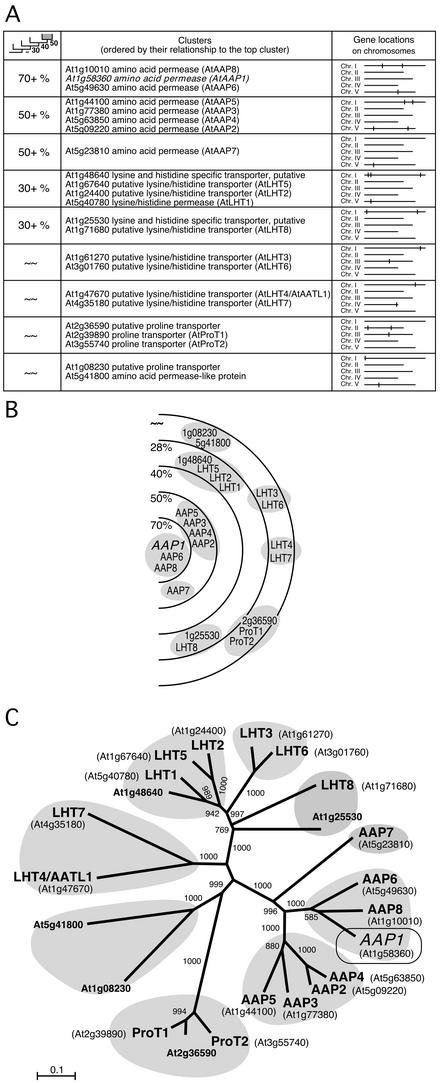
A specialized database (DB) for Arabidopsis membrane proteins, ARAMEMNON, was designed that facilitates the interpretation of gene and protein sequence data by integrating features that are presently only available from individual sources. Using several publicly available prediction programs, putative integral membrane proteins were identified among the approximately 25,500 proteins in the Arabidopsis genome DBs. By averaging the predictions from seven programs, approximately 6,500 proteins were classified as transmembrane (TM) candidate proteins. Some 1,800 of these contain at least four TM spans and are possibly linked to transport functions. The ARAMEMNON DB enables direct comparison of the predictions of seven different TM span computation programs and the predictions of subcellular localization by eight signal peptide recognition programs. A special function displays the proteins related to the query and dynamically generates a protein family structure. As a first set of proteins from other organisms, all of the approximately 700 putative membrane proteins were extracted from the genome of the cyanobacterium Synechocystis sp. and incorporated in the ARAMEMNON DB. The ARAMEMNON DB is accessible at the URL http://aramemnon.botanik.uni-koeln.de.
Figures
Similar articles
-
TransportDB: a relational database of cellular membrane transport systems.Nucleic Acids Res. 2004 Jan 1;32(Database issue):D284-8. doi: 10.1093/nar/gkh016. Nucleic Acids Res. 2004. PMID: 14681414 Free PMC article.
-
Identification and Characterization of Plant Membrane Proteins Using ARAMEMNON.Methods Mol Biol. 2018;1696:249-259. doi: 10.1007/978-1-4939-7411-5_17. Methods Mol Biol. 2018. PMID: 29086409
-
The gene complement for proteolysis in the cyanobacterium Synechocystis sp. PCC 6803 and Arabidopsis thaliana chloroplasts.Curr Genet. 2002 Aug;41(5):291-310. doi: 10.1007/s00294-002-0309-8. Epub 2002 Jul 18. Curr Genet. 2002. PMID: 12185496 Review.
-
Functional classification of membrane transporters and channels based on filtered TM/non-TM amino acid composition.Biopolymers. 2012 Jul;97(7):558-67. doi: 10.1002/bip.22043. Biopolymers. 2012. PMID: 22492257
-
The MIP family of integral membrane channel proteins: sequence comparisons, evolutionary relationships, reconstructed pathway of evolution, and proposed functional differentiation of the two repeated halves of the proteins.Crit Rev Biochem Mol Biol. 1993;28(3):235-57. doi: 10.3109/10409239309086796. Crit Rev Biochem Mol Biol. 1993. PMID: 8325040 Review.
Cited by
-
Current status of the plant phosphorylation site database PhosPhAt and its use as a resource for molecular plant physiology.Front Plant Sci. 2012 Jun 19;3:132. doi: 10.3389/fpls.2012.00132. eCollection 2012. Front Plant Sci. 2012. PMID: 22723801 Free PMC article.
-
Compensatory mutations in predicted metal transporters modulate auxin conjugate responsiveness in Arabidopsis.G3 (Bethesda). 2013 Jan;3(1):131-41. doi: 10.1534/g3.112.004655. Epub 2013 Jan 1. G3 (Bethesda). 2013. PMID: 23316445 Free PMC article.
-
Phylogenetic Analysis of the Thylakoid ATP/ADP Carrier Reveals New Insights into Its Function Restricted to Green Plants.Front Plant Sci. 2012 Jan 9;2:110. doi: 10.3389/fpls.2011.00110. eCollection 2011. Front Plant Sci. 2012. PMID: 22629269 Free PMC article.
-
Analysis of the compartmentalized metabolome - a validation of the non-aqueous fractionation technique.Front Plant Sci. 2011 Sep 22;2:55. doi: 10.3389/fpls.2011.00055. eCollection 2011. Front Plant Sci. 2011. PMID: 22645541 Free PMC article.
-
Overexpression of the NMig1 Gene Encoding a NudC Domain Protein Enhances Root Growth and Abiotic Stress Tolerance in Arabidopsis thaliana.Front Plant Sci. 2020 Jun 11;11:815. doi: 10.3389/fpls.2020.00815. eCollection 2020. Front Plant Sci. 2020. PMID: 32595686 Free PMC article.
References
-
- Andre B. An overview of membrane transport proteins in Saccharomyces cerevisiae. Yeast. 1995;11:1575–1611. - PubMed
-
- Arabidopsis Genome Initiative. Analysis of the genome sequence of the flowering plant Arabidopsis thaliana. Nature. 2000;408:796–815. - PubMed
-
- Bannai H, Tamada Y, Maruyama O, Nakai K, Miyano S. Extensive feature detection of N-terminal protein sorting signals. Bioinformatics. 2002;18:298–305. - PubMed
-
- Berman HM, Battistuz T, Bhat TN, Bluhm WF, Bourne PE, Burkhardt K, Feng Z, Gilliland GL, Iype L, Jain S et al. The protein data bank. Acta Crystallogr D Biol Crystallogr. 2002;58:899–907. - PubMed
-
- Claros MG, Vincens P. Computational method to predict mitochondrially imported proteins and their targeting sequences. Eur J Biochem. 1996;241:779–786. - PubMed
Publication types
MeSH terms
Substances
LinkOut - more resources
Full Text Sources
Other Literature Sources
Molecular Biology Databases
Research Materials
Miscellaneous
