Comparative Study
. 2003 Jan;131(1):264-75.
doi: 10.1104/pp.011155.

Functional mitochondrial complex I is required by tobacco leaves for optimal photosynthetic performance in photorespiratory conditions and during transients

Affiliations
Comparative Study

Functional mitochondrial complex I is required by tobacco leaves for optimal photosynthetic performance in photorespiratory conditions and during transients

Christelle Dutilleul et al. Plant Physiol. 2003 Jan.

Abstract

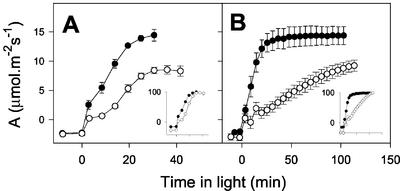
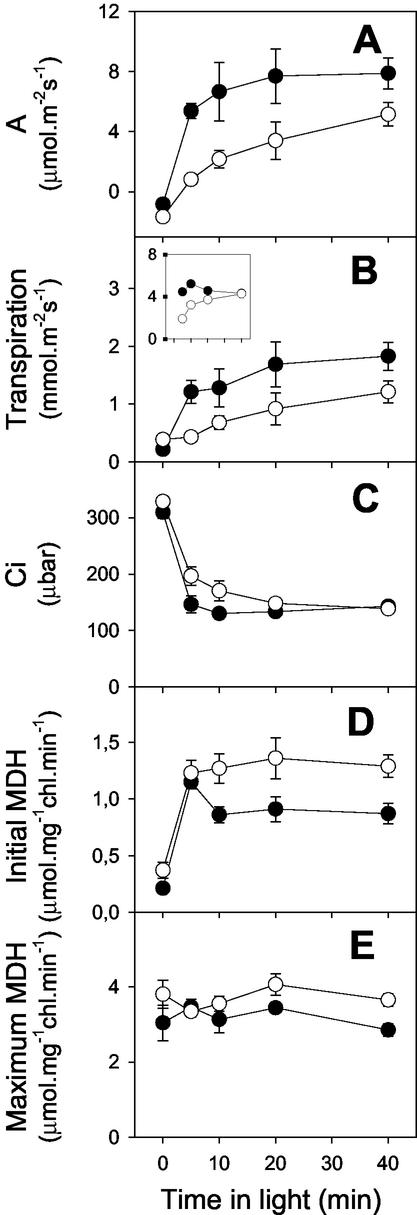
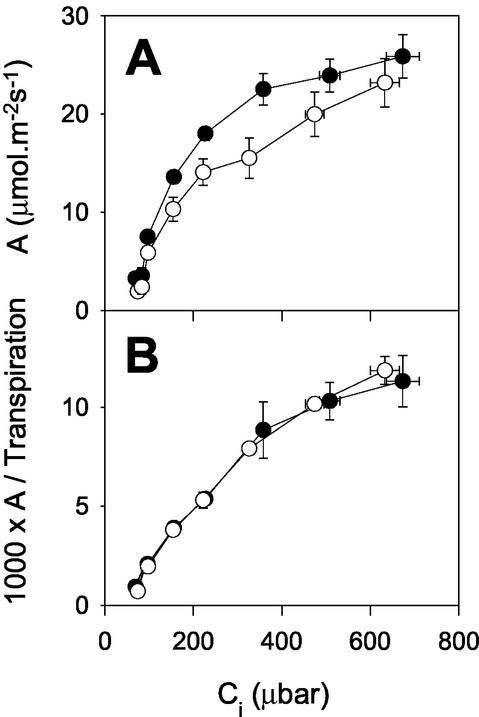
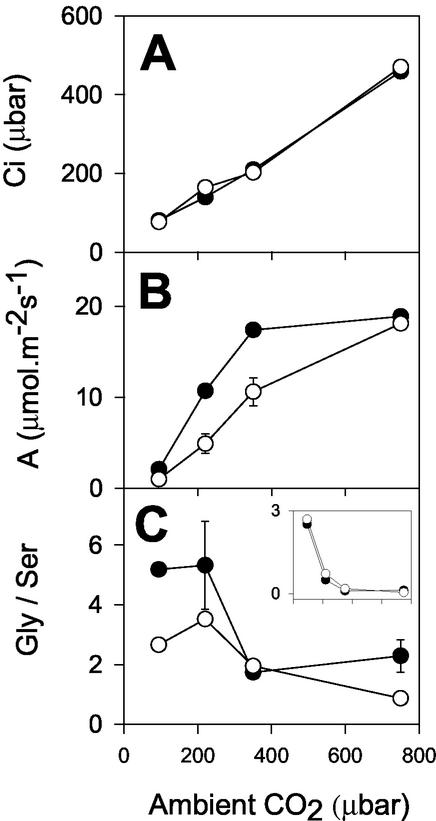
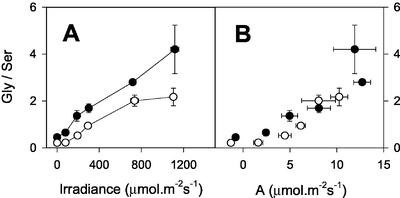
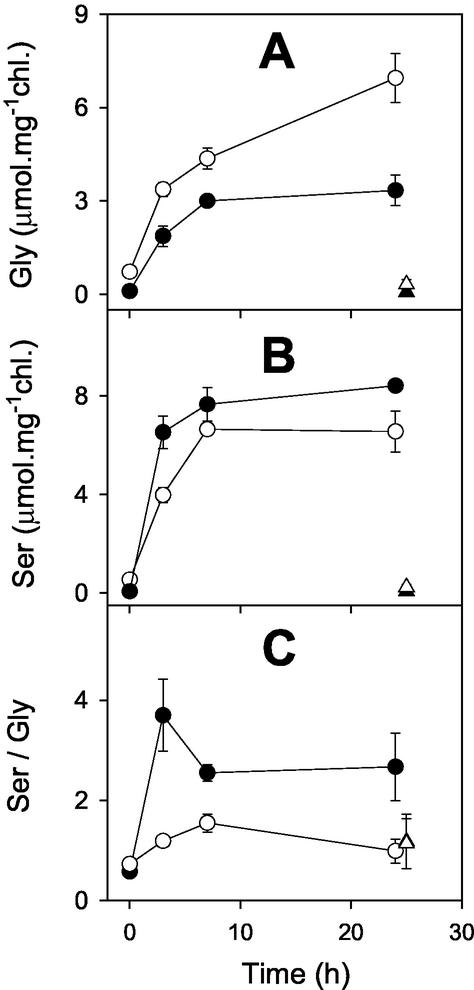
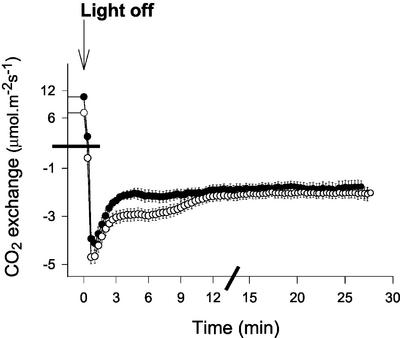
The importance of the mitochondrial electron transport chain in photosynthesis was studied using the tobacco (Nicotiana sylvestris) mutant CMSII, which lacks functional complex I. Rubisco activities and oxygen evolution at saturating CO(2) showed that photosynthetic capacity in the mutant was at least as high as in wild-type (WT) leaves. Despite this, steady-state photosynthesis in the mutant was reduced by 20% to 30% at atmospheric CO(2) levels. The inhibition of photosynthesis was alleviated by high CO(2) or low O(2). The mutant showed a prolonged induction of photosynthesis, which was exacerbated in conditions favoring photorespiration and which was accompanied by increased extractable NADP-malate dehydrogenase activity. Feeding experiments with leaf discs demonstrated that CMSII had a lower capacity than the WT for glycine (Gly) oxidation in the dark. Analysis of the postillumination burst in CO(2) evolution showed that this was not because of insufficient Gly decarboxylase capacity. Despite the lower rate of Gly metabolism in CMSII leaves in the dark, the Gly to Ser ratio in the light displayed a similar dependence on photosynthesis to the WT. It is concluded that: (a) Mitochondrial complex I is required for optimal photosynthetic performance, despite the operation of alternative dehydrogenases in CMSII; and (b) complex I is necessary to avoid redox disruption of photosynthesis in conditions where leaf mitochondria must oxidize both respiratory and photorespiratory substrates simultaneously.


Figures

Figure 1
Figure 1
Mitochondrial complex I deficiency is associated with delayed induction of photosynthesis in the CMSII mutant. Black circles, WT. White circles, CMSII. A, Ambient CO2 = 360 μbar. B, Ambient CO2 = 250 μbar. In both cases, irradiance was 700 μmol m−2 s−1 and O2 pressure was 210 mbar. Insets show net CO2 exchange normalized to the final values attained by each plant (plotted on same x axis scale as non-normalized rates). Data are means ± se of three different attached leaves. Where not apparent, error bars are contained within the symbols. The experiments were carried out with separate sets of plants. Similar results were obtained in two other experiments with different sets of plants.
Figure 2
Figure 2
Gas exchange and NADP-MDH activities in attached leaves from WT and CMSII tobacco during the induction period of photosynthesis. Black circles, WT. White circles, CMSII. Plants were dark adapted for 60 min, then illuminated at 700 μmol m−2 s−1, 210 mbar O2, and 250 μbar CO2 before metabolism was stopped by freeze clamping samples for MDH assays. Each data point is the mean ± se of a different set of four plants. A, Net CO2 uptake; B, transpiration (the inset shows 1,000× net CO2 uptake/transpiration, plotted on the same x axis scale as the main panel); C, intercellular CO2 concentration; D, initial MDH activity; E, maximum MDH activity.
Figure 3
Figure 3
Ci curves for photosynthesis in CMSII and WT tobacco. Black circles, WT. White circles, CMSII. A, Net CO2 uptake. B, Net CO2 uptake divided by transpiration. Gas exchange was measured on attached leaves illuminated at 210 mbar O2 and ambient CO2 varying from 70 to 1,000 μbar at an irradiance of 700 μmol m−2 s−1. Data are means ± se of four to 16 plants. Where not apparent, error bars are contained within the symbols.
Figure 4
Figure 4
The inhibition of photosynthesis in CMSII in photorespiratory conditions is not associated with increased Gly/Ser. Black circles, WT. White circles, CMSII. A, Intercellular CO2 concentration. B, Net CO2 uptake. C, Gly/Ser. The inset shows the ratio between Gly/Ser and the rate of net CO2 uptake, calculated from data shown in B and C. Values are means of two independent measurements at each condition. Error bars show actual values and are contained within the symbols where not apparent.
Figure 5
Figure 5
Effect of irradiance on Gly/Ser in CMSII and WT leaves. Black circles, WT. White circles, CMSII. A, Gly/Ser against irradiance. B, Relationship between Gly/Ser and net CO2 uptake. Attached leaves were illuminated at the irradiance indicated (210 mbar O2, 360 μbar CO2, 22°C) until the steady-state rate of net CO2 fixation was reached. Samples were then taken for analysis of Ser and Gly by freeze clamping. Data are means ± se of four different plants. Where not apparent, error bars are contained within the symbols.
Figure 6
Figure 6
Leaf discs from CMSII convert Gly to Ser in the dark at lower rates than do WT leaf discs. Black circles, WT. White circles, CMSII. Discs were supplied with 50 mm Gly and 5 mm HEPES (pH 7.0), incubated at room temperature in the dark, and samples were taken at the time indicated for analysis of Ser and Gly. For further details, see “Materials and Methods.” Triangles show data for discs maintained in the dark on 5 mm HEPES (pH 7.0). Data are means ± se of three samples, each composed of eight discs. Where not apparent, error bars are contained within the symbols.
Figure 7
Figure 7
Analysis of postillumination CO2 release in the WT tobacco and CMSII. Black circles, WT. White circles, CMSII. Gas exchange was analyzed in four different CMSII and WT plants. Attached leaves were illuminated at 1,000 μmol m−2 s−1, 200 μbar CO2, and 210 mbar O2 until the steady state was reached. Leaves were abruptly darkened and CO2 evolution monitored. Data are means ± se of leaves from four different plants. Where not apparent, error bars are contained within the symbols. Note the discontinuous axis scaling, indicated by bars.

References

    1. Backhausen JE, Emmerlich A, Holtgrefe S, Horton P, Nast G, Rogers JM, Müller-Röber B, Scheibe R. Transgenic potato plants with altered expression levels of chloroplast NADP-malate dehydrogenase: interactions between photosynthetic electron transport and malate metabolism in leaves and in isolated intact chloroplasts. Planta. 1998;207:105–114.
    1. Backhausen JE, Scheibe R. Adaptation of tobacco plants to elevated CO2: influence of leaf age on changes in physiology, redox states and NADP-malate dehydrogenase activity. J Exp Bot. 1999;50:665–675.
    1. Blackwell RD, Murray AJS, Lea PJ. Photorespiratory mutants of the mitochondrial conversion of glycine to serine. Plant Physiol. 1990;94:1316–1322. - PMC - PubMed
    1. Cornic G, Briantais J-M. Partitioning of photosynthetic electron flow between CO2 and O2 reduction in a C3 leaf (Phaseolus vulgaris L.) at different CO2 concentrations and during drought stress. Planta. 1991;183:178–184. - PubMed
    1. Douce R, Neuburger M. The uniqueness of plant mitochondria. Annu Rev Plant Physiol Plant Mol Biol. 1989;40:371–414.

Publication types

MeSH terms

LinkOut - more resources