. 2003 Feb 4;100(3):1209-14.
doi: 10.1073/pnas.0237043100. Epub 2003 Jan 16.

Deletion of the RAG2 C terminus leads to impaired lymphoid development in mice

Affiliations

Deletion of the RAG2 C terminus leads to impaired lymphoid development in mice

Yoshiko Akamatsu et al. Proc Natl Acad Sci U S A. .

Abstract

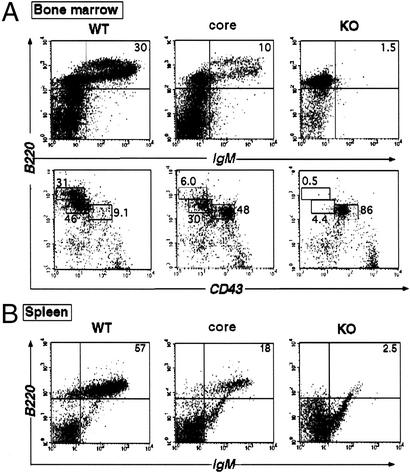
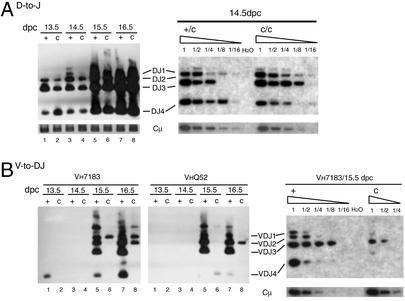
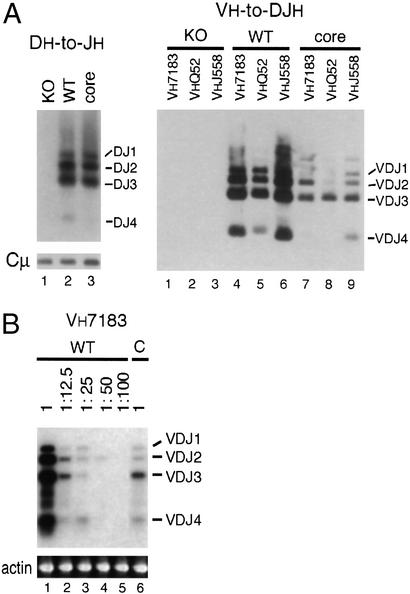
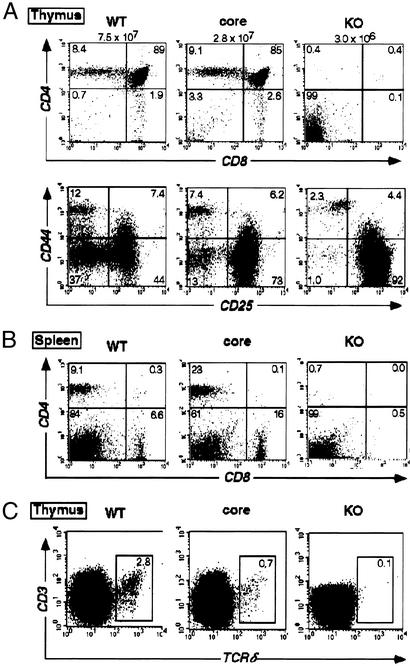
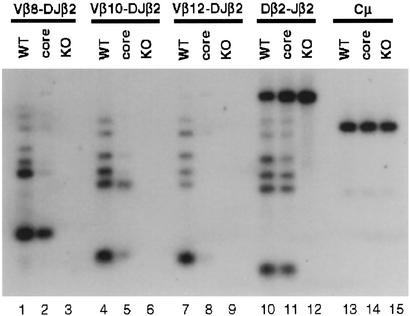
The recombination-activating gene (RAG)1 and RAG2 proteins comprise the lymphocyte-specific components of the V(D)J recombinase and are required for the assembly of antigen-receptor variable-region genes. A mutant truncated RAG2 protein ("core" RAG2) lacking the C-terminal 144 amino acids, together with core RAG1, is able to mediate the basic biochemical steps required for V(D)J recombination in vitro and in transfected cell lines. Here we examine the effect of replacing the endogenous RAG2 locus in mice with core RAG2. These mice generate substantial numbers of B and T cells, demonstrating that the core RAG2 protein retains significant in vivo function. However, core RAG2 mice display a reduction in the total number of B and T cells, reflecting impaired lymphocyte development at the progenitor stage associated with reduced chromosomal V(D)J recombination. We discuss potential roles of the RAG2 C terminus in mediating rearrangement of endogenous antigen-receptor loci.


Figures

Figure 1
Figure 1
B cell development of core RAG2 mice is impaired. (A) Representative FACS analysis of bone marrow cells from RAG2 WT (+/−), core (c/−), and knockout (KO, −/−) mice stained with CyC-anti-B220 and either PE-anti-IgM or FITC-anti-CD43. (B) FACS analysis of peripheral splenic B cells from RAG2 WT (+/−), core (c/−), and knockout (−/−) mice stained with CyC-anti-B220 and PE-anti-IgM. The percentage of B220+IgM+ cells of total lymphocytes is shown. The percentages of B220 and CD43 staining are calculated on the basis of the total number of B220+ cells in each sample.
Figure 2
Figure 2
VH-to-DJH rearrangement is reduced in developing B cells from core RAG2 mice. (A) PCR analysis of DH-to-JH rearrangement in fetal liver genomic DNA from RAG WT (+/c) and core (c/c) littermates is shown with serial dilutions from 14.5-dpc embryos (Right). (Left) PCR amplification of Cμ is included as a loading control and shown at the bottom. (B) PCR analysis of VH-to-DJH rearrangement of VH7183 and VHQ52 segments with serial dilutions for VH7183 rearrangements from 15.5-dpc embryos (Right). PCR products were probed with the JH4 probe.
Figure 3
Figure 3
Reduced VH-to-DJH rearrangement in sorted core RAG2 pro-B cells. (A) PCR analysis of DH-to-JH rearrangement (Left) and VH-to-DJH rearrangement of VH7183, VHQ52, and VHJ558 segments (Right) in B220loCD43+ cells sorted from the bone marrow of RAG WT (+/−) and core (c/−) mice. Cμ amplification is shown (Left) as a control for input DNA. (B) Serial dilutions of WT DNA were amplified and compared with undiluted core DNA. The ratio of the mixed DNA (WT:KO) is indicated above each lane. The same dilutions were amplified with primers specific for β-actin as a control for DNA input.
Figure 4
Figure 4
Analysis of T cell development in core RAG2 mice. (A Upper) FACS analysis of thymocytes from RAG2 WT (+/−), core (c/−), and knockout (KO−/−) mice using CD8-CyC and CD4-PE. (Lower) FACS analysis of thymocytes using CD44-PE and CD25-FITC after the removal of CD4+, CD8+, B220+, MAC1+, and GR1+ cells by electronic gating. (B) FACS analysis of splenic T cells using CD8-CyC and CD4-PE. (C) FACS analysis of thymocytes using TCRδ-FITC and CD3-PE after the removal of CD4+ and CD8+ cells by electronic gating.
Figure 5
Figure 5
Analysis of TCRβ rearrangement. PCR analysis of Dβ2-to-Jβ2 and Vβ-to-Dβ2Jβ2 rearrangement on DNA isolated from sorted CD44CD25+ (DNIII) thymocytes of RAG2 WT (+/c), core (c/c), and knockout (KO, −/−) mice is shown. PCR amplification of Cμ was included as a loading control.

References

    1. Bassing C H, Swat W, Alt F W. Cell. 2002;109,Suppl.:S45–S55. - PubMed
    1. Gellert M. Annu Rev Biochem. 2002;71:101–132. - PubMed
    1. Hesslein D G, Schatz D G. Adv Immunol. 2001;78:169–232. - PubMed
    1. Rajewsky K. Nature. 1996;381:751–758. - PubMed
    1. Gorman J R, Alt F W. Adv Immunol. 1998;69:113–181. - PubMed

Publication types

LinkOut - more resources