

Brain metabolite profiles of T1-hypointense lesions in relapsing-remitting multiple sclerosis
- PMID: 12533329
- PMCID: PMC8148958
Brain metabolite profiles of T1-hypointense lesions in relapsing-remitting multiple sclerosis
Abstract
Background and purpose: Persistent T1-hypointense lesions ("black holes") are thought to represent permanent damage of brain parenchyma. We attempted to ascertain whether the metabolic profiles of these hypointense areas support this hypothesis and whether these profiles correlate with these hypointense findings.
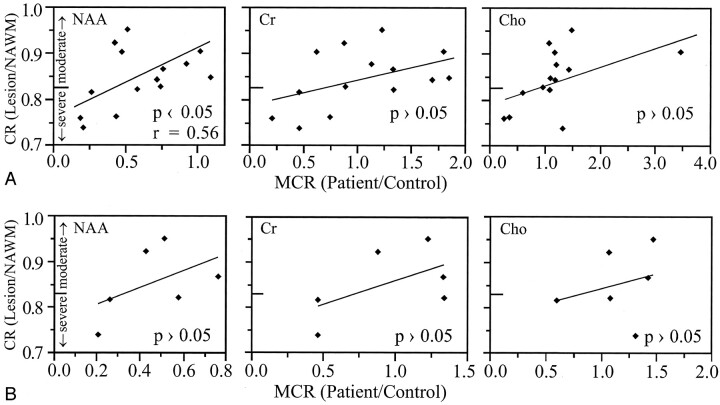
Methods: Four patients with relapsing-remitting multiple sclerosis and four matched control volunteers underwent MR imaging and 3D proton MR spectroscopy. Absolute levels of N-acetylaspartate (NAA), creatine, and choline (Cho) were obtained in 0.19 cm(3) voxels containing 14 T1-hypointense lesions (average volume, 0.4 cm(3); range, 0.2-1.0 cm(3)) in patients. Metabolite levels were analyzed, by using Pearson correlation, against their respective lesions' hypointensity relative to the surrounding normal-appearing white matter.
Results: Moderate correlation, r = 0.56, was found between the NAA level and MR imaging hypointensity. Of the 14 lesions studied, 12 were deficient in NAA and 11 had excess Cho compared with corresponding brain regions in control volunteers. Only one lesion was significantly deficient in all three metabolites, indicative of total damage or matrix loss.
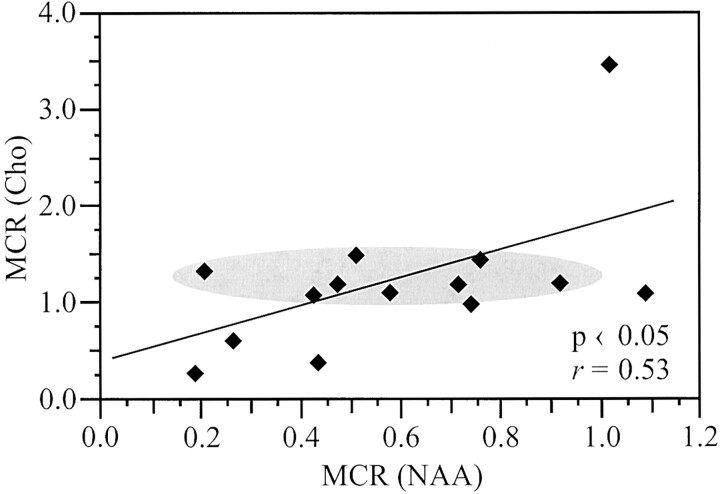
Conclusion: No relationship was found between the hypointensity of the lesions and their metabolic profile. Specifically, lesions with the same hypointensity on T1-weighted MR images were metabolically variable (ie, displayed disparate metabolite levels and behavior). Also, although 86% of the lesions exhibited abnormally low NAA, 71% also had increased Cho. This indicates that although neuronal damage had already occurred (lower NAA), these lesions were still "smoldering" with active membrane turnover (high Cho), most likely because of de- and remyelination, indicative of shadow plaques (remyelinated lesions). Consequently, relapsing-remitting hypointense lesions represent neither final-stage nor static pathologic abnormality.
Figures


References
-
- Simon JH. Contrast-enhanced MR imaging in the evaluation of treatment response and prediction of outcome in multiple sclerosis. J Magn Reson Imag 1997;7:29–37 - PubMed
-
- McFarland HF, Barkhof F, Antel J, Miller DH. The role of MRI as a surrogate outcome measure in multiple sclerosis. Mult Scler 2002;8:40–51 - PubMed
-
- Miki Y, Grossman RI, Udupa JK, et al. Relapsing-remitting multiple sclerosis: longitudinal analysis of MR images: lack of correlation between changes in T2 lesion volume and clinical findings. Radiology 1999;213:395–399 - PubMed
-
- Ciccarelli O, Brex PA, Thompson AJ, Miller DH. Disability and lesion load in MS: a reassessment with MS functional composite score and 3D fast FLAIR. J Neurol 2002;249:18–24 - PubMed
Publication types
MeSH terms
Substances
Grants and funding
LinkOut - more resources
Full Text Sources
Medical