Correlation between brain reorganization, ischemic damage, and neurologic status after transient focal cerebral ischemia in rats: a functional magnetic resonance imaging study
- PMID: 12533611
- PMCID: PMC6741861
- DOI: 10.1523/JNEUROSCI.23-02-00510.2003
Correlation between brain reorganization, ischemic damage, and neurologic status after transient focal cerebral ischemia in rats: a functional magnetic resonance imaging study
Abstract
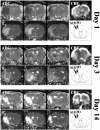
The pattern and role of brain plasticity in stroke recovery has been incompletely characterized. Both ipsilesional and contralesional changes have been described, but it remains unclear how these relate to functional recovery. Our goal was to correlate brain activation patterns with tissue damage, hemodynamics, and neurologic status after temporary stroke, using functional magnetic resonance imaging (fMRI). Transverse relaxation time (T2)-weighted, diffusion-weighted, and perfusion MRI were performed at days 1 (n = 7), 3 (n = 7), and 14 (n = 7) after 2 hr unilateral middle cerebral artery occlusion in rats. Functional activation and cerebrovascular reactivity maps were generated from contrast-enhanced fMRI during forelimb stimulation and hypercapnia, respectively. Before MRI, rats were examined neurologically. We detected loss of activation responses in the ipsilesional sensorimotor cortex, which was related to T2 lesion size (r = -0.858 on day 3, r = -0.979 on day 14; p < 0.05). Significant activation responses in the contralesional hemisphere were detected at days 1 and 3. The degree of shift in balance of activation between the ipsilesional and contralesional hemispheres, characterized by the laterality index, was linked to the T2 and apparent diffusion coefficient in the ipsilesional contralesional forelimb region of the primary somatosensory cortex and primary motor cortex at day 1 (r = -0.807 and 0.782, respectively; p < 0.05) and day 14 (r = -0.898 and -0.970, respectively; p < 0.05). There was no correlation between activation parameters and perfusion status or cerebrovascular reactivity. Finally, we found that the laterality index and neurologic status changed in parallel over time after stroke, so that when all time points were grouped together, neurologic status was inversely correlated with the laterality index (r = -0.571; p = 0.016). This study suggests that the degree of shift of activation balance toward the contralesional hemisphere early after stroke increases with the extent of tissue injury and that functional recovery is associated mainly with preservation or restoration of activation in the ipsilesional hemisphere.
Figures


References
-
- Abo M, Chen Z, Lai LJ, Reese T, Bjelke B. Functional recovery after brain lesion–contralateral neuromodulation: an fMRI study. NeuroReport. 2001;12:1543–1547. - PubMed
-
- Allegrini PR, Sauer D. Application of magnetic resonance imaging to the measurement of neurodegeneration in rat brain: MRI data correlate strongly with histology and enzymatic analysis. Magn Reson Imaging. 1992;10:773–778. - PubMed
-
- Aoyagi A, Saito H, Abe K, Nishiyama N. Early impairment and late recovery of synaptic transmission in the rat dentate gyrus following transient forebrain ischemia in vivo. Brain Res. 1998;799:130–137. - PubMed
-
- Bederson JB, Pitts LH, Tsuji M, Nishimura MC, Davis RL, Bartkowski H. Rat middle cerebral artery occlusion: evaluation of the model and development of a neurologic examination. Stroke. 1986;17:472–476. - PubMed
-
- Bolay H, Dalkara T. Mechanisms of motor dysfunction after transient MCA occlusion: persistent transmission failure in cortical synapses is a major determinant. Stroke. 1998;29:1988–1994. - PubMed
Publication types
MeSH terms
Substances
Grants and funding
- R01-NS38731/NS/NINDS NIH HHS/United States
- P01-CA48729/CA/NCI NIH HHS/United States
- P50 NS010828/NS/NINDS NIH HHS/United States
- R01 HL039810/HL/NHLBI NIH HHS/United States
- R01 NS038477/NS/NINDS NIH HHS/United States
- R01-HL39810/HL/NHLBI NIH HHS/United States
- P41 RR014075/RR/NCRR NIH HHS/United States
- P41-RR14075/RR/NCRR NIH HHS/United States
- R01-NS37074/NS/NINDS NIH HHS/United States
- P50-NS10828/NS/NINDS NIH HHS/United States
- R01-NS38477/NS/NINDS NIH HHS/United States
- R01 NS037074/NS/NINDS NIH HHS/United States
- R01 NS038731/NS/NINDS NIH HHS/United States
LinkOut - more resources
Full Text Sources
Other Literature Sources
Medical
